



- ASO A/B testing compares app icon, screenshot, or description variants using App Store PPO or Google Play Store Listing Experiments.
- Run every ASO A/B test for a minimum of 7 to 14 days to avoid misleading early-winner results that later reverse.
- Good app store conversion rate benchmarks depend on category, ranging from 4-6% for games up to 36% for utilities.
- App Store PPO caps confidence at a fixed 90% threshold; Google Play lets you choose 90%, 95%, 98%, or 99%.
- Testing one variable at a time is mandatory: multi-element changes produce a winner without revealing what caused the result.
- A/B testing never directly affects keyword ranking, but higher conversion improves install velocity, which indirectly boosts organic visibility.
You’ve spent weeks perfecting your app icon, rewriting your title five times, and still your downloads barely move. Sound familiar? The truth is, most app owners guess their way through App Store Optimization instead of testing it, and guessing is expensive.
ASO A/B testing is the process of experimenting with different versions of your app’s icon, screenshots, title, and description to determine which one drives more installs, using real user data rather than assumptions.
It’s the difference between hoping your listing works and knowing it does. This is exactly why many growing apps bring in an experienced ASO agency, not just to write better copy, but to run structured, statistically sound experiments that remove the guesswork entirely.
In this guide, we’ll break down how App Store Optimization testing actually works, which elements move the needle most, and how to build a testing process that consistently improves your conversion rates over time.
What Is ASO A/B Testing?
ASO A/B testing is the practice of showing two or more versions of your app store listing, such as the icon, screenshots, video, title, or description, to different groups of real users. It helps identify which version converts more visitors into app installs.
Instead of guessing what looks better, ASO A/B testing lets real user behavior guide your decisions. On iOS, you can run tests using Product Page Optimization (PPO) in App Store Connect.
On Android, you can use Store Listing Experiments in Google Play Console. Both are free, built-in tools that let you run basic tests without installing any third-party SDKs.
Split Test vs. Multivariate Test vs. Full Page Experiment
Not all ASO tests work the same way. Here’s the difference:
| Test Type | What It Does | Best For |
| Split test | Tests one element head-to-head (Icon A vs. Icon B) | Beginners, fast answers |
| Multivariate test | Tests combinations of multiple elements at once | Advanced teams with high traffic |
| Full page experiment | Tests a completely redesigned listing against the original | Major rebrands or relaunches |
Most teams should start with split tests. They’re simpler to run and way easier to learn from.
Why Is A/B Testing Important for ASO?
A/B testing is important for ASO because it replaces guesswork with data, and even a small conversion lift compounds into a lot of extra installs without spending another dollar on ads.
Here’s the math nobody skips: if 100,000 people see your app page every month and your conversion rate goes from 30% to 33%, that’s 3,000 extra installs, same traffic, same budget, just a smarter page. That lift also compounds indirectly: better conversion improves install velocity, and install velocity is one of the signals stores use to rank you in search and browse results.
A/B testing also gives you a low-risk way to validate a change before it goes live for everyone. Beyond “which icon wins,” A/B testing pays off in a few concrete ways:
- Low-risk validation: Test UI or feature updates, seasonal creatives, or a major relaunch direction before committing to it for everyone.
- Lower cost per install: If you’re running paid UA, a higher-converting page means every ad click works harder.
- Better-fit users: When your listing accurately shows what the app does, the people who install it are more likely to stick around.
- Staying ahead: If competitors are testing and you’re not, they’re learning things about your shared audience that you aren’t.
A good ASO A/B test always gives you value. It either improves your conversion rate or helps you better understand what your users prefer.
What’s a Good App Store Conversion Rate in 2026?
A good App Store conversion rate beats your category’s average. There’s no single number that works for every app.
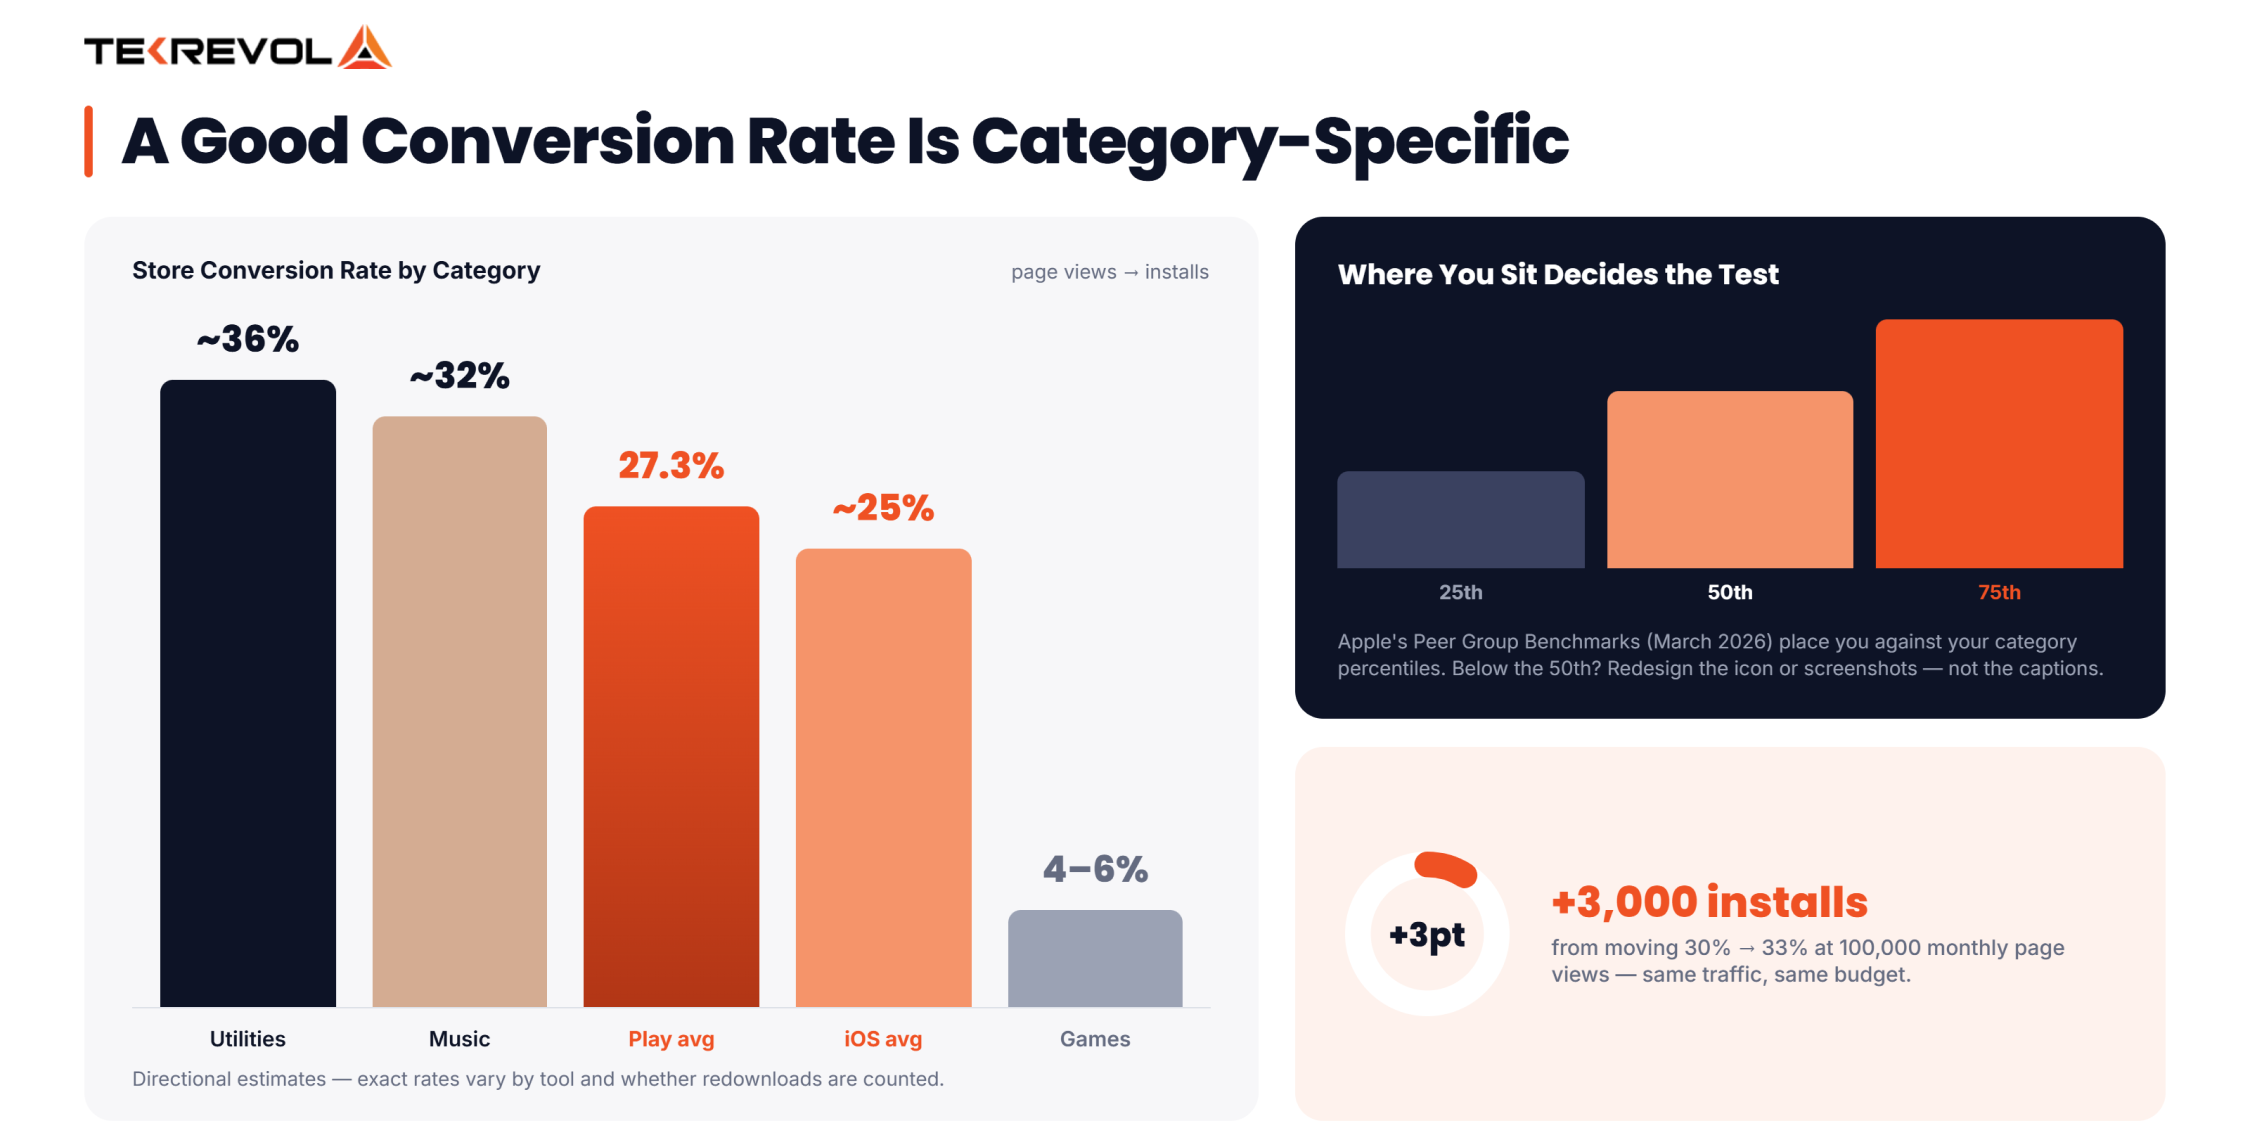
The cross-category average sits at roughly 25% on the App Store and 27.3% on Google Play, per AppTweak’s most cited benchmark. Use average conversion rates as a general guide, not a rule. Different ASO tools measure conversions in different ways, so results can vary. What matters most is how your app compares with others in the same category.
| Category | Approx. iOS CVR (2026) |
| Utilities | ~36% |
| Music | ~32% |
| Navigation | ~30%+ (inflated by re-download counting) |
| Shopping/Food & Drink | ~30-52% (brand traffic skews this up) |
| Health & Fitness | ~20-25% |
| Finance | ~18% |
| Games | ~4-6% |
Note: Figures are directional estimates based on recent ASO industry benchmark data; exact rates vary by measurement methodology (redownloads counted, page views vs. impressions).
In March 2026, Apple added Peer Group Benchmarks to App Store Connect Analytics, where your conversion rate and retention are measured against the 25th, 50th, and 75th percentile of apps in your category. Apple shows these as estimated ranges, not exact numbers. Benchmark data is only available when enough similar apps qualify.
Check Apple’s benchmark data before relying on industry averages. If you’re around the 50th percentile, you’re performing about the same as similar apps. If you’re below it, there’s room to improve. And this is exactly why the percentile matters for A/B testing: if your category median is 30% and you’re at 15%, skip the caption tweak and go straight for a full icon or screenshot redesign. You have room for a big swing, not a small one.
Is your conversion rate actually bad, or just normal for your category?
TekRevol benchmarks your CVR against your exact category and download tier, so your first test targets the real gap.
Get My Free Conversion Benchmark Report →Key App Store Elements You Should A/B Test
You can test almost every visible piece of your app store page, split into two buckets: pre-tap and post-tap. Pre-tap elements are what users see before they click into your page — search results or browse tabs. Post-tap elements are what they see once they’re on your product page.
Pre-Tap Elements
- App icon — colors, characters, shapes, brand emphasis
- Title and subtitle — clarity, keyword placement, tone
- First screenshot — shows up in search results on some placements
Post-Tap Elements
- Full screenshot set — order, captions, layout
- Long description — opening line, formatting, feature order
- Feature graphic (Google Play only) — background, text, call to action
- Preview video — thumbnail, pacing, first few seconds
App Icon Testing
Your icon is the first thing anyone sees, in search results or on a featured list. Small changes here move the needle more than you’d expect.
What to test: color palette, a character vs. no character, minimalist vs. detailed, background shape. Some top game development companies have found that swapping a character’s expression (happy vs. determined) changed tap-through rate significantly.
One practical catch: Unlike screenshots and videos, testing a new app icon on iOS requires submitting a new app version for App Review. Since approval takes time, plan your icon tests well in advance.
Screenshot Testing
Screenshots do the heavy lifting once someone’s on your page. Users scroll fast, so the first two or three need to say everything.
What to test: Test the screenshot order, add or remove text overlays, try different background colors, highlight one feature per screenshot, and test portrait or landscape layouts for games.
The first three do more work than people think. Studies suggest that around 90% of users don’t scroll past the first three screenshots. Some research also found that up to 80% of conversion differences come from those first three images. If you only have time for one test this quarter, run it here.
Preview Video Testing
Videos autoplay silently and can grab attention quickly. Before spending more on video production, test whether adding a video actually improves your conversion rate.
What to test: the thumbnail (poster frame), the first 3-5 seconds, video length (15 seconds vs. 30), and captions for sound-off viewing.
Many teams assume an app preview video will improve conversions, but that’s not always true. For Finance and Productivity apps, users often prefer clear screenshots that highlight key features and security. Start by testing video vs. no video before comparing different video versions.
Title, Subtitle & Description Testing
Testability gets tricky here, since not every store lets you test every text field. Google Play gives you the most flexibility; the App Store gives you the least; subtitle isn’t directly A/B testable on either platform today. You can’t test subtitle changes using PPO or Store Listing Experiments. The best approach is to update the subtitle and monitor how it affects search visibility and app performance.
Google Play only: Test the first line of your long description, compare bullet points with paragraphs, and try different short description styles, such as feature-focused versus benefit-focused.
What Changed in ASO A/B Testing for 2026
- The Peer Benchmarking tab in App Store Connect Analytics now includes over 100 additional metrics, including download-to-paid conversion benchmarks. If you haven’t used it in a while, it’s a good time to check the latest data.
- Some ASO experts believe Apple may index screenshot captions, while others disagree. Since there’s no official confirmation, use screenshot captions to improve conversions first, and consider any search visibility benefits a bonus.
- Google Play Store Listing Experiments has offered “retained first-time installers” as a target metric since 2022, not as a new 2026 feature, but it remains underused. If you’re still defaulting to raw install count, switching to retained installers is one of the easiest upgrades you can make to any existing test.
How Much Traffic Do You Need for a Statistically Valid ASO A/B Test?
You need enough traffic to reach your target confidence level, and that number depends on your current conversion rate, your traffic volume, and how big a lift you’re trying to detect.
This is the part every native testing tool buries in a settings menu labeled “minimum detectable effect” (MDE) and never explains. Here’s the plain version:
- Smaller expected lift = bigger sample size needed: Detecting a 2% improvement takes far more traffic than detecting a 15% improvement.
- Lower starting conversion rate = bigger sample size needed: A 5% baseline (typical for games) needs more visitors per test than a 30% baseline (typical for utilities).
- Higher confidence level = bigger sample size needed: Going from 90% to 99% confidence roughly doubles your required sample in most cases.
Practical rule of thumb: if your app gets under 1,000 store page views a day, stick to testing high-impact elements (icon, first screenshot) where lifts tend to be bigger and easier to detect. If you’re doing 10,000+ views a day, you can afford to test smaller, subtler changes like caption wording or screenshot order.
How Does ASO A/B Testing Work on the App Store vs. Google Play?
Apple and Google Play both support testing multiple listing versions. However, their features and limitations are different, so plan your tests accordingly.
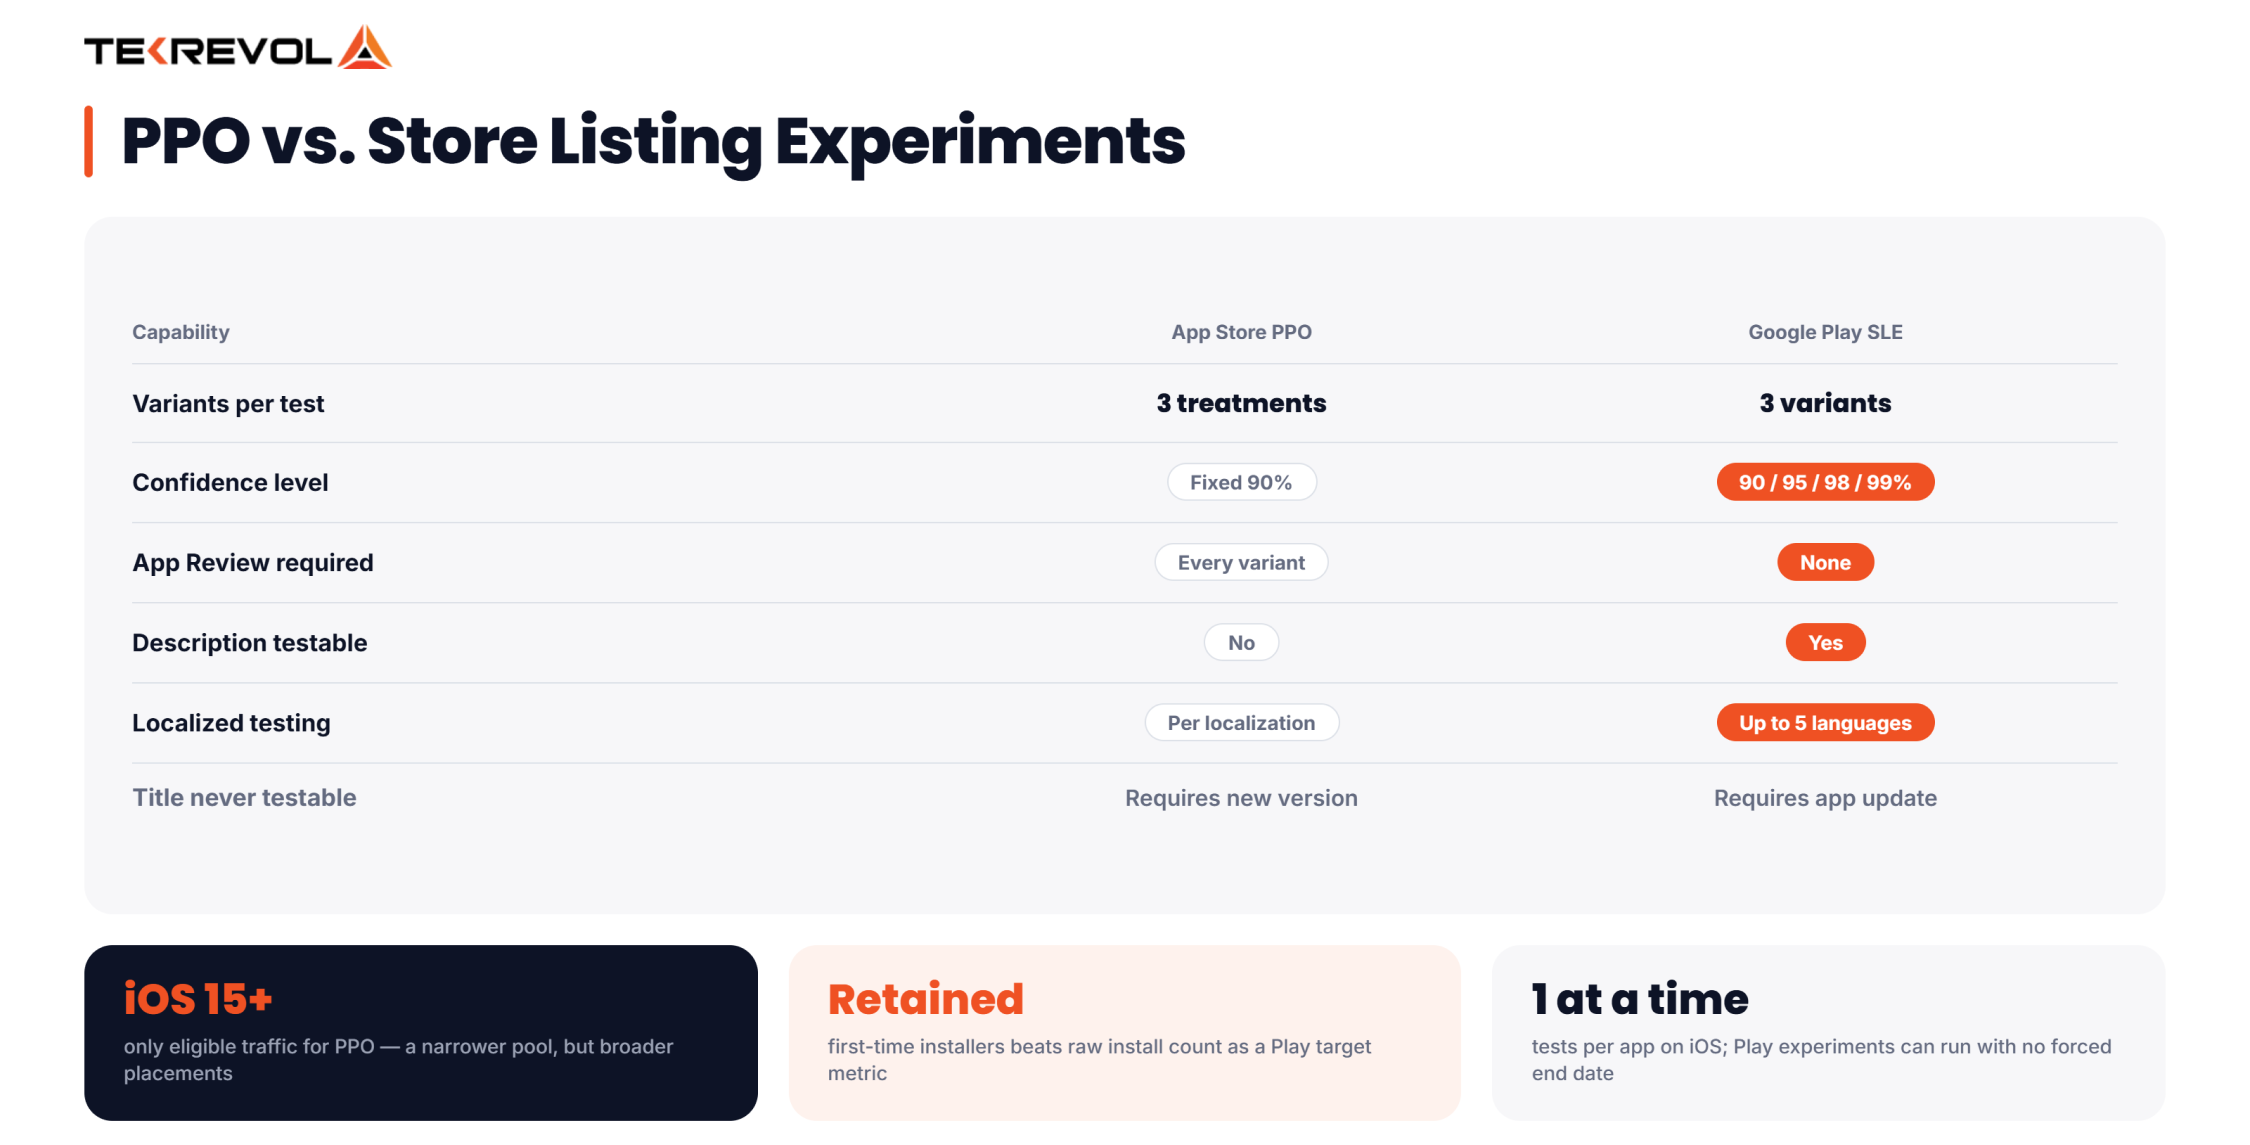
On the App Store, testing runs through Product Page Optimization (PPO):
- Create up to three treatment variants of your product page, tested against your default listing
- Results are only visible to users on iOS 15 or later, which narrows your eligible traffic pool
- Testing is scoped to your product page elements, icon, screenshots, video, not your core App Store metadata like your title.
- Treatments can appear across the Today tab, Apps tab, and search results, helping you optimize for the App Store Ranking Algorithm through better user engagement.
On Google Play, testing runs through Store Listing Experiments:
- Also supports up to three variants, but tests can run indefinitely with no forced end date
- Choose between a global test (one language, all users) or a localized test (up to five languages at once), which makes regional testing far more direct than on iOS
- Off-limits for testing: app title, pricing, and custom store listings
- Experiments apply only to your main store listing, not to any custom listings built for specific traffic sources
The takeaway: Apple ASO gives you narrower eligible traffic but broader placement visibility. Google gives you longer test windows and stronger localization control but locks down more of your core metadata. Which quirks matter most to you should shape which elements you prioritize testing first, and on which store.
Here’s the side-by-side on exactly what’s testable where:
| Element | App Store (PPO) | Google Play (SLE) |
| App icon | yes | yes |
| Screenshots | yes | yes |
| Preview video | yes | yes |
| App title | no | no |
| Subtitle | no | Not applicable |
| Short description | Not applicable | yes |
| Long description | No | yes |
| Feature graphic | Not applicable | yes |
| Max variants | 3 | 3 |
| Test duration | Up to 90 days | Minimum ~7 days, no fixed max |
| Requires app review | yes | no |
| Localized testing | Yes | Yes, up to 5 languages |
Not sure whether to test on the App Store or Google Play first?
TekRevol maps a testing sequence around your traffic, timeline, and each platform's restrictions.
Book Your Free A/B Testing Roadmap Session!How to Set Up an A/B Test in App Store Connect?
To set up a test in App Store Connect, go to your app’s Product Page Optimization tab, create a new test, upload your variants, and submit for review.
Here’s the exact flow:
- Log into App Store Connect and select your app.
- Go to Features > Product Page Optimization.
- Click Create Test and name it something specific (e.g., “Icon color test”).
- Choose the number of treatments (up to 3).
- Set your traffic split; even splits give you the cleanest data.
- Select which localizations the test applies to.
- Upload your new creative assets for each treatment.
- Submit for App Review, then click Start Test once approved.
App Store A/B Testing Limitations to Know Before You Start
On the App Store, you can only run one test at a time for each app. Testing your title or subtitle isn’t supported, as Product Page Optimization only covers creative assets. Apple also manages the statistical analysis for you. It uses Bayesian models and only reports a variant as “Performing Better” or “Performing Worse” after reaching a 90% confidence threshold. Unlike Google Play, there’s no setting to raise that threshold to 95% or 99%.
How to Set Up an A/B Test in Google Play Console
To set up a test in Google Play Console, go to Growth, click Store Listing Experiments, choose global or localized, then set your variants and confidence level.
Here’s the exact flow:
- Log into Google Play Console and select your app.
- Go to Grow > Store Listing Experiments.
- Click Create Experiment.
- Choose global (all users, one language) or localized (up to 5 languages).
- Name the experiment clearly, like “Icon_US” or “Screenshots_DE.”
- Choose your target metric (retained first-time installers is usually the better pick).
- Set traffic allocation and minimum detectable effect (MDE).
- Select confidence level (90%, 95%, 98%, or 99%).
- Upload your variants and click Start Experiment.
Google Play A/B Testing Limitations to Know Before You Start
You can’t test your app’s title with Store Listing Experiments because changing the title requires a full app update. Native experiments also don’t separate paid and organic traffic, so both are included in the same results.
How to Build an Effective ASO A/B Testing Strategy
The best ASO strategy for A/B tests follows a repeatable process: research, hypothesize, test one variable, run it long enough, hit statistical significance, then document and repeat.
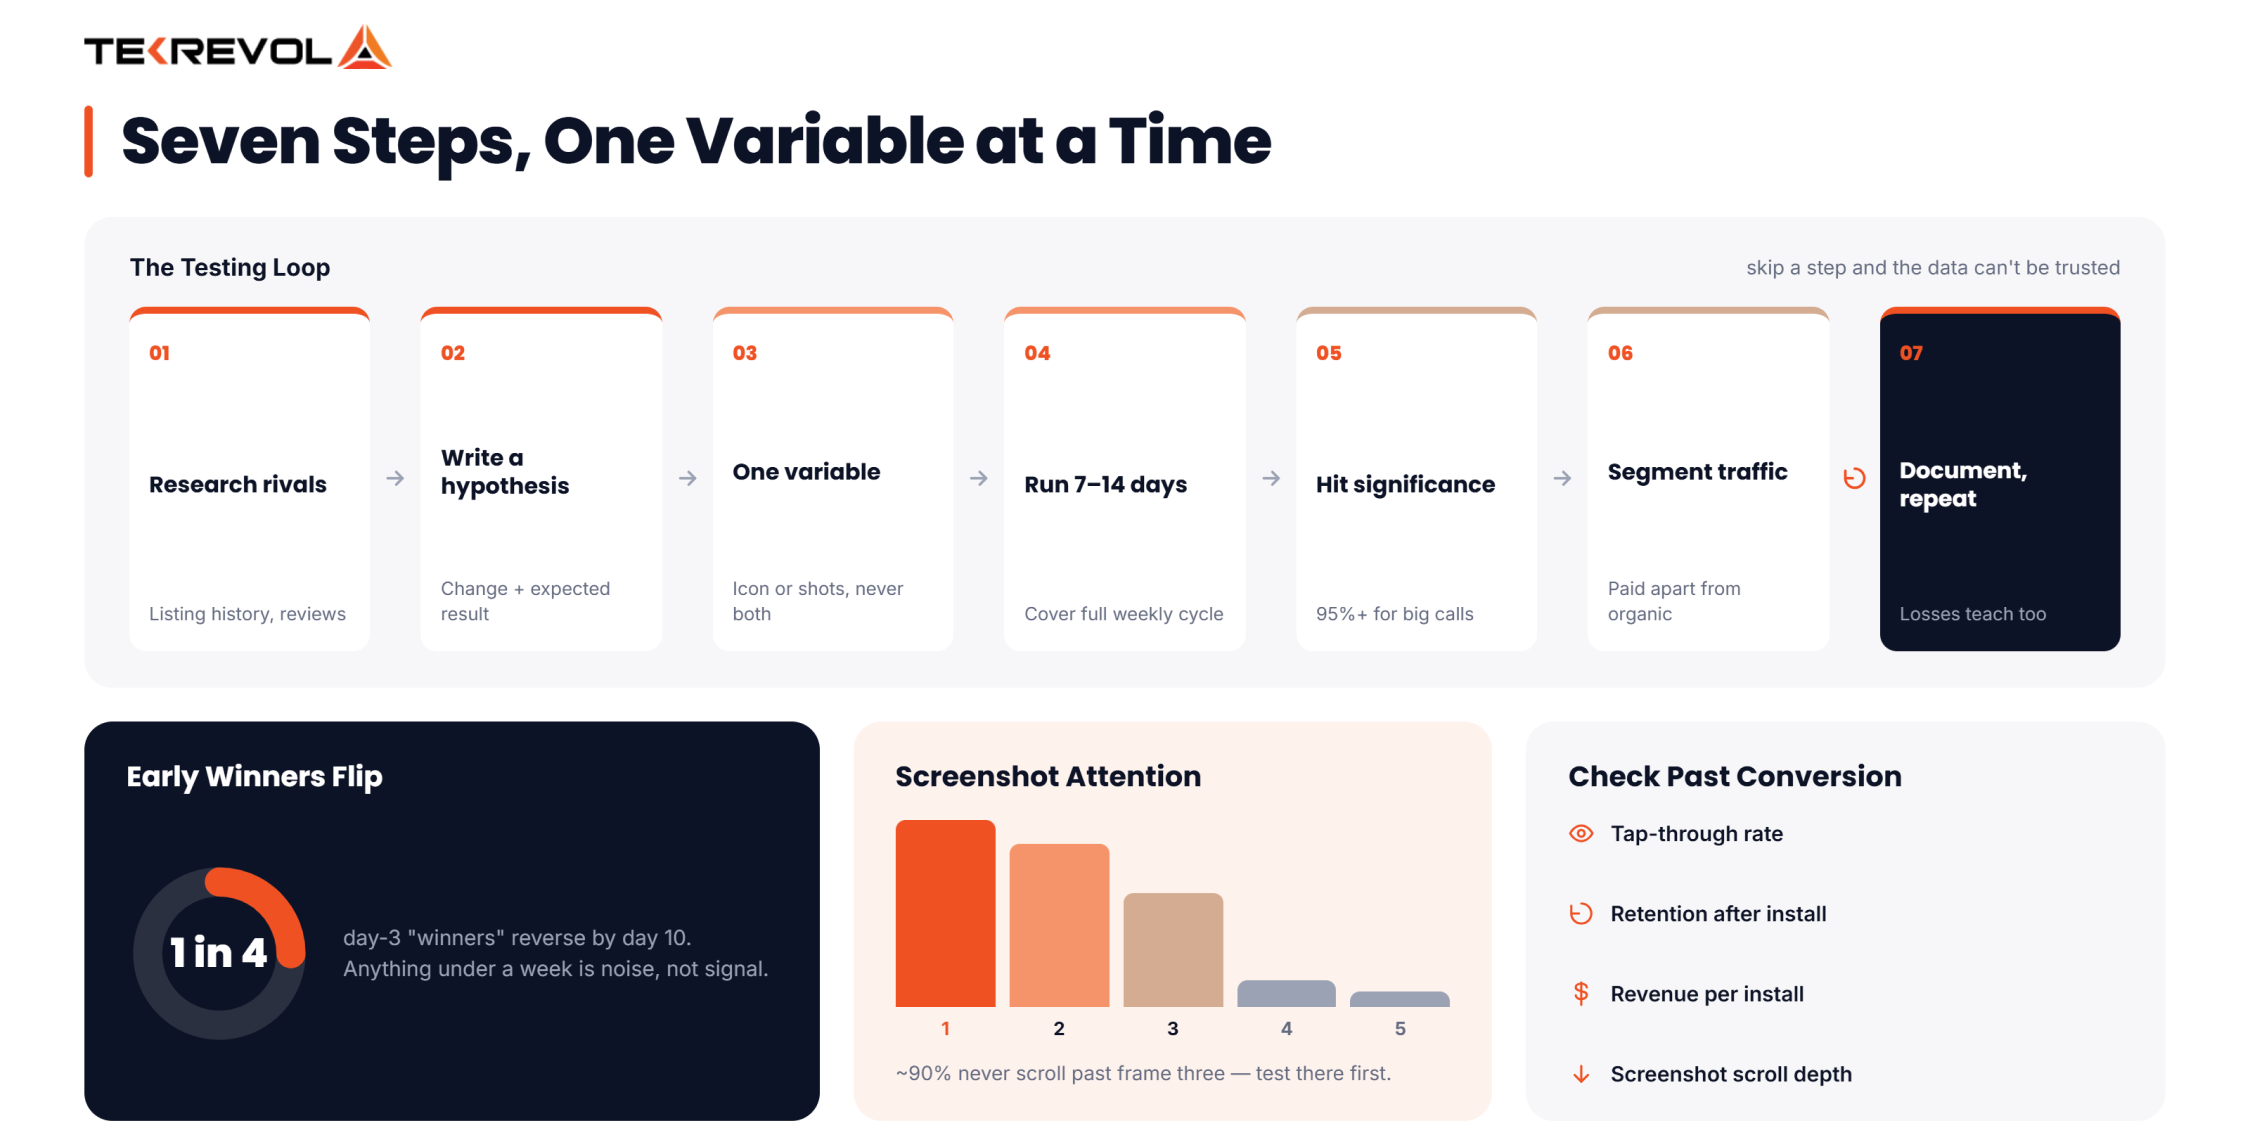
Skip a step, and you’ll end up with data you can’t actually trust.
Step 1: Research Competitors & Audience First
Look at what’s already working in your category before you touch a single asset. What do top-ranking apps emphasize in their first screenshot? What does your audience actually respond to in reviews?
Step 2: Form a Clear, Testable Hypothesis
A real hypothesis names the change and the expected result. “If we change our icon from blue to orange, tap-through rate will increase because orange stands out more in a mostly blue category.” Vague guesses don’t count.
Step 3: Test One Variable at a Time
Change the icon, or the screenshots, or the description. Never all three in the same test. If you change everything at once, you’ll have a winner but no idea why it won.
Step 4: Choose the Right Test Duration (7-14+ Days)
User behavior shifts across weekdays and weekends. A test that runs 2-3 days will show you a fake “early winner” that often flips once a full week of data comes in. Run tests for at least 7 days, ideally 14.
Step 5: Reach Statistical Significance (90% vs. 95% vs. 99%)
Statistical significance tells you whether your result is real or random noise. Google Play defaults to 90%, which is fine for low-risk tests. For a big decision, like a full icon redesign, push for 95% or higher to avoid false positives.
Step 6: Segment Traffic (Paid vs. Organic, Localization)
Paid traffic behaves differently than organic traffic. If you’re running ads during your test, your results could be skewed by users who arrived with completely different expectations. Where possible, isolate the two.
Step 7: Analyze Results & Document Learnings
Even a “losing” test teaches you something about your audience. Write down the hypothesis, the result, and what you learned, win or lose. So your next test builds on this one instead of starting from zero.
This is also where most in-house teams fall off. TekRevol’s ASO team runs this exact loop as part of ongoing app store management for clients: research, hypothesis, single-variable test, documented result, repeat. The biggest value comes from documenting every test. Over time, those learnings help you make better decisions than any single winning test.
How to Find Yourself Among the Competitors: Spying on Rival A/B Tests
You can find an edge over competitors by tracking what they’re changing on their store listing over time, then using that pattern as a source of test ideas, not something to copy outright.
Your competitors are testing right now. Most ASO teams never look, because they assume there’s no way to see it. There is.
What to Look For in a Competitor’s Listing History
Every time a competitor changes their icon, reshuffles screenshots, or swaps a preview video, that’s a visible signal, even without knowing their internal results. What matters is the pattern, not any single change:
- Frequency: An app that updates its screenshots every few weeks is actively testing. One that hasn’t touched its listing in a year probably isn’t.
- Direction: If a competitor moves from cluttered, text-heavy screenshots to cleaner, single-message ones, that’s a signal about what’s working for their audience, and possibly yours, if you share a category.
- Category-wide shifts: If several apps in your space all move toward brighter colors, video-first listings, or shorter descriptions within the same quarter, that’s rarely coincidence. Something is converting.
Using Test Results to Build Your Next Hypothesis
Seeing a competitor’s change isn’t the same as knowing why it worked; their brand, baseline conversion rate, and audience aren’t identical to yours. Treat it as a starting hypothesis, not a conclusion. If a competitor’s new screenshot style sticks around for months instead of getting reverted, that’s a decent sign it’s winning for them. Test the same idea against your own baseline before assuming it’ll work for you too.
You don’t need a dedicated tool to start; checking a competitor’s App Store or Google Play listing every few weeks and screenshotting the changes gets you most of the way there. ASO platforms that track metadata history over time just automate that tracking instead of you doing it by hand.
Common ASO A/B Testing Mistakes to Avoid
The most common ASO A/B testing mistake is ending a test too early, before it hits statistical significance.
Other mistakes that quietly wreck good tests:
- Testing multiple elements at once: You get a winner, but no idea what actually caused it.
- Ignoring traffic source: Mixing paid and organic traffic in one test blurs your results.
- Assuming results transfer across stores: A winning App Store icon doesn’t automatically win on Google Play. Different audience, different behavior.
- Running tests during holidays or big campaigns: Seasonal spikes and ad pushes distort what would otherwise be clean data.
- Picking a “winner” that isn’t statistically significant: If the data’s inconclusive, that’s not a green light; it’s a sign to keep testing.
- Treating a conversion win as an automatic win: A variant can raise install rate while pulling in users who churn faster or convert to paying customers less often. Before rolling out a winning variant, check more than just the conversion rate. Also review user retention and, if your app is monetized, early revenue per install.
Native Tools vs. Third-Party A/B Testing Platforms
Native tools (App Store Connect, Google Play Console) are free and fine for basic tests. Third-party platforms cost more but unlock pre-launch testing, more variants, and deeper analytics.
| Feature | Native Tools | Third-Party Platforms |
| cost | free | paid |
| Pre-launch testing | No | Yes |
| Max variants | 3 | Often more (up to 8+) |
| Traffic control | Limited | Full control, custom targeting |
| Metrics available | Basic (2-3) | 30-50+ detailed metrics |
| Testing methodology | Fixed | Bayesian, sequential, multi-armed bandit |
When You Actually Need a Third-Party Tool
If you want to test your page before launch, need more than 3 variants, or want to isolate paid traffic from organic, native tools won’t cut it; that’s when a dedicated third-party ASO testing platform earns its price tag.
The “Testing methodology” row matters more than it looks. Native tools use one fixed model, while third-party platforms let you choose: Bayesian for ongoing live tests, sequential for big pre-launch decisions, or multi-armed bandit for short seasonal windows where you want traffic shifting to the leading variant automatically.
At TekRevol, we don’t sell A/B testing software, so we’re not recommending a specific platform. If your app gets fewer than 1,000 daily product page views, the native tools from Apple and Google Play are usually all you need.
How to Read Your ASO A/B Test Results (And Which Metrics Actually Matter)
Every A/B test ends one of three ways, and each tells you something different:
- Clear winner: Roll it out to 100% of your listing and move to your next hypothesis.
- Original wins: Not a failure; ask why the change didn’t land. That’s still useful data about your audience.
- No significant difference: Also not wasted effort. It tells you that element might matter less than you thought, so you can prioritize testing something else.
Don’t stop at conversion rate when judging any of the three. A higher conversion rate doesn’t always mean a better result. Check TTR, retention, and screenshot scroll depth to make sure new users stay engaged after installing.
How TekRevol Helps You With ASO
Running A/B tests is only half the job. Knowing what to test, why, and what to do with the results is the other half, and that’s where most in-house teams get stuck.
At TekRevol, we help you identify the highest-impact elements to test, set clear goals, and measure results that support long-term app growth.
We’ve shipped 500+ apps since 2018, with app store optimization built into that process from day one. Our team runs the testing process end to end, so yours doesn’t have to.
Your app's next install spike shouldn't depend on a guess.
Let's build an ASO testing roadmap around your app's actual numbers.
Talk to Our ASO Team!


