Monitoring microservices means measuring how each service handles requests and following one request across every service it touches. Microservices monitoring is harder than watching a single application, because a failure can start in one service and show up in another.
This guide gives you the TekRevol Triage Map, a four-question order for incidents. It then shows which metrics, traces, logs, and alerts answer each question.
How does monitoring differ between a monolith and a microservices system?
A monolith needs one process watched, while microservices need many small services and the calls between them watched. Dash0 notes that logging in to one host to read its log stops working at scale, because microservices usually run in short-lived containers that each produce their own logs and metrics. The monolith vs microservices trade-off explains the design reasons behind that shift.
| Area | Monolith | Microservices |
| What you watch | One application and its host | Many services, their containers and the calls between them |
| Where a failure shows | Usually in the process that failed | Often in a different service from the one that failed |
| What one log line tells you | Most of the story | One piece of a request’s path |
| How you find the cause | Read the one log | Follow the request across services |
This table is TekRevol’s summary.
Why are microservices hard to monitor?
Microservices are hard to monitor because one user request crosses many services, and each service can fail on its own. Dash0 says a small team owns each service’s life cycle, and finding the owner of a failing service is a challenge. InfluxData lists service dependencies, root cause analysis across services, mixed technology stacks, and scale. Groundcover adds data volume, since every service produces its own telemetry.
Dash0 says agents that run from the host userspace do not work well with containers. Teams that commission TekRevol’s custom software services for a system built from many services should plan monitoring before the first service ships.
Monitoring tells a team that something is wrong, and microservices observability gives it enough data to find out why. Google’s SRE book frames monitoring as answering two questions: what is broken, and why. OpenTelemetry describes observability as the ability to understand a system from the outside by asking questions about it, without knowing its internals.
The TekRevol Triage Map: four questions to ask during an incident
The TekRevol Triage Map orders a microservices incident into four questions: what is broken, where, why, and what breaks next. Each question has one signal that answers it and one decision about whether to page someone.
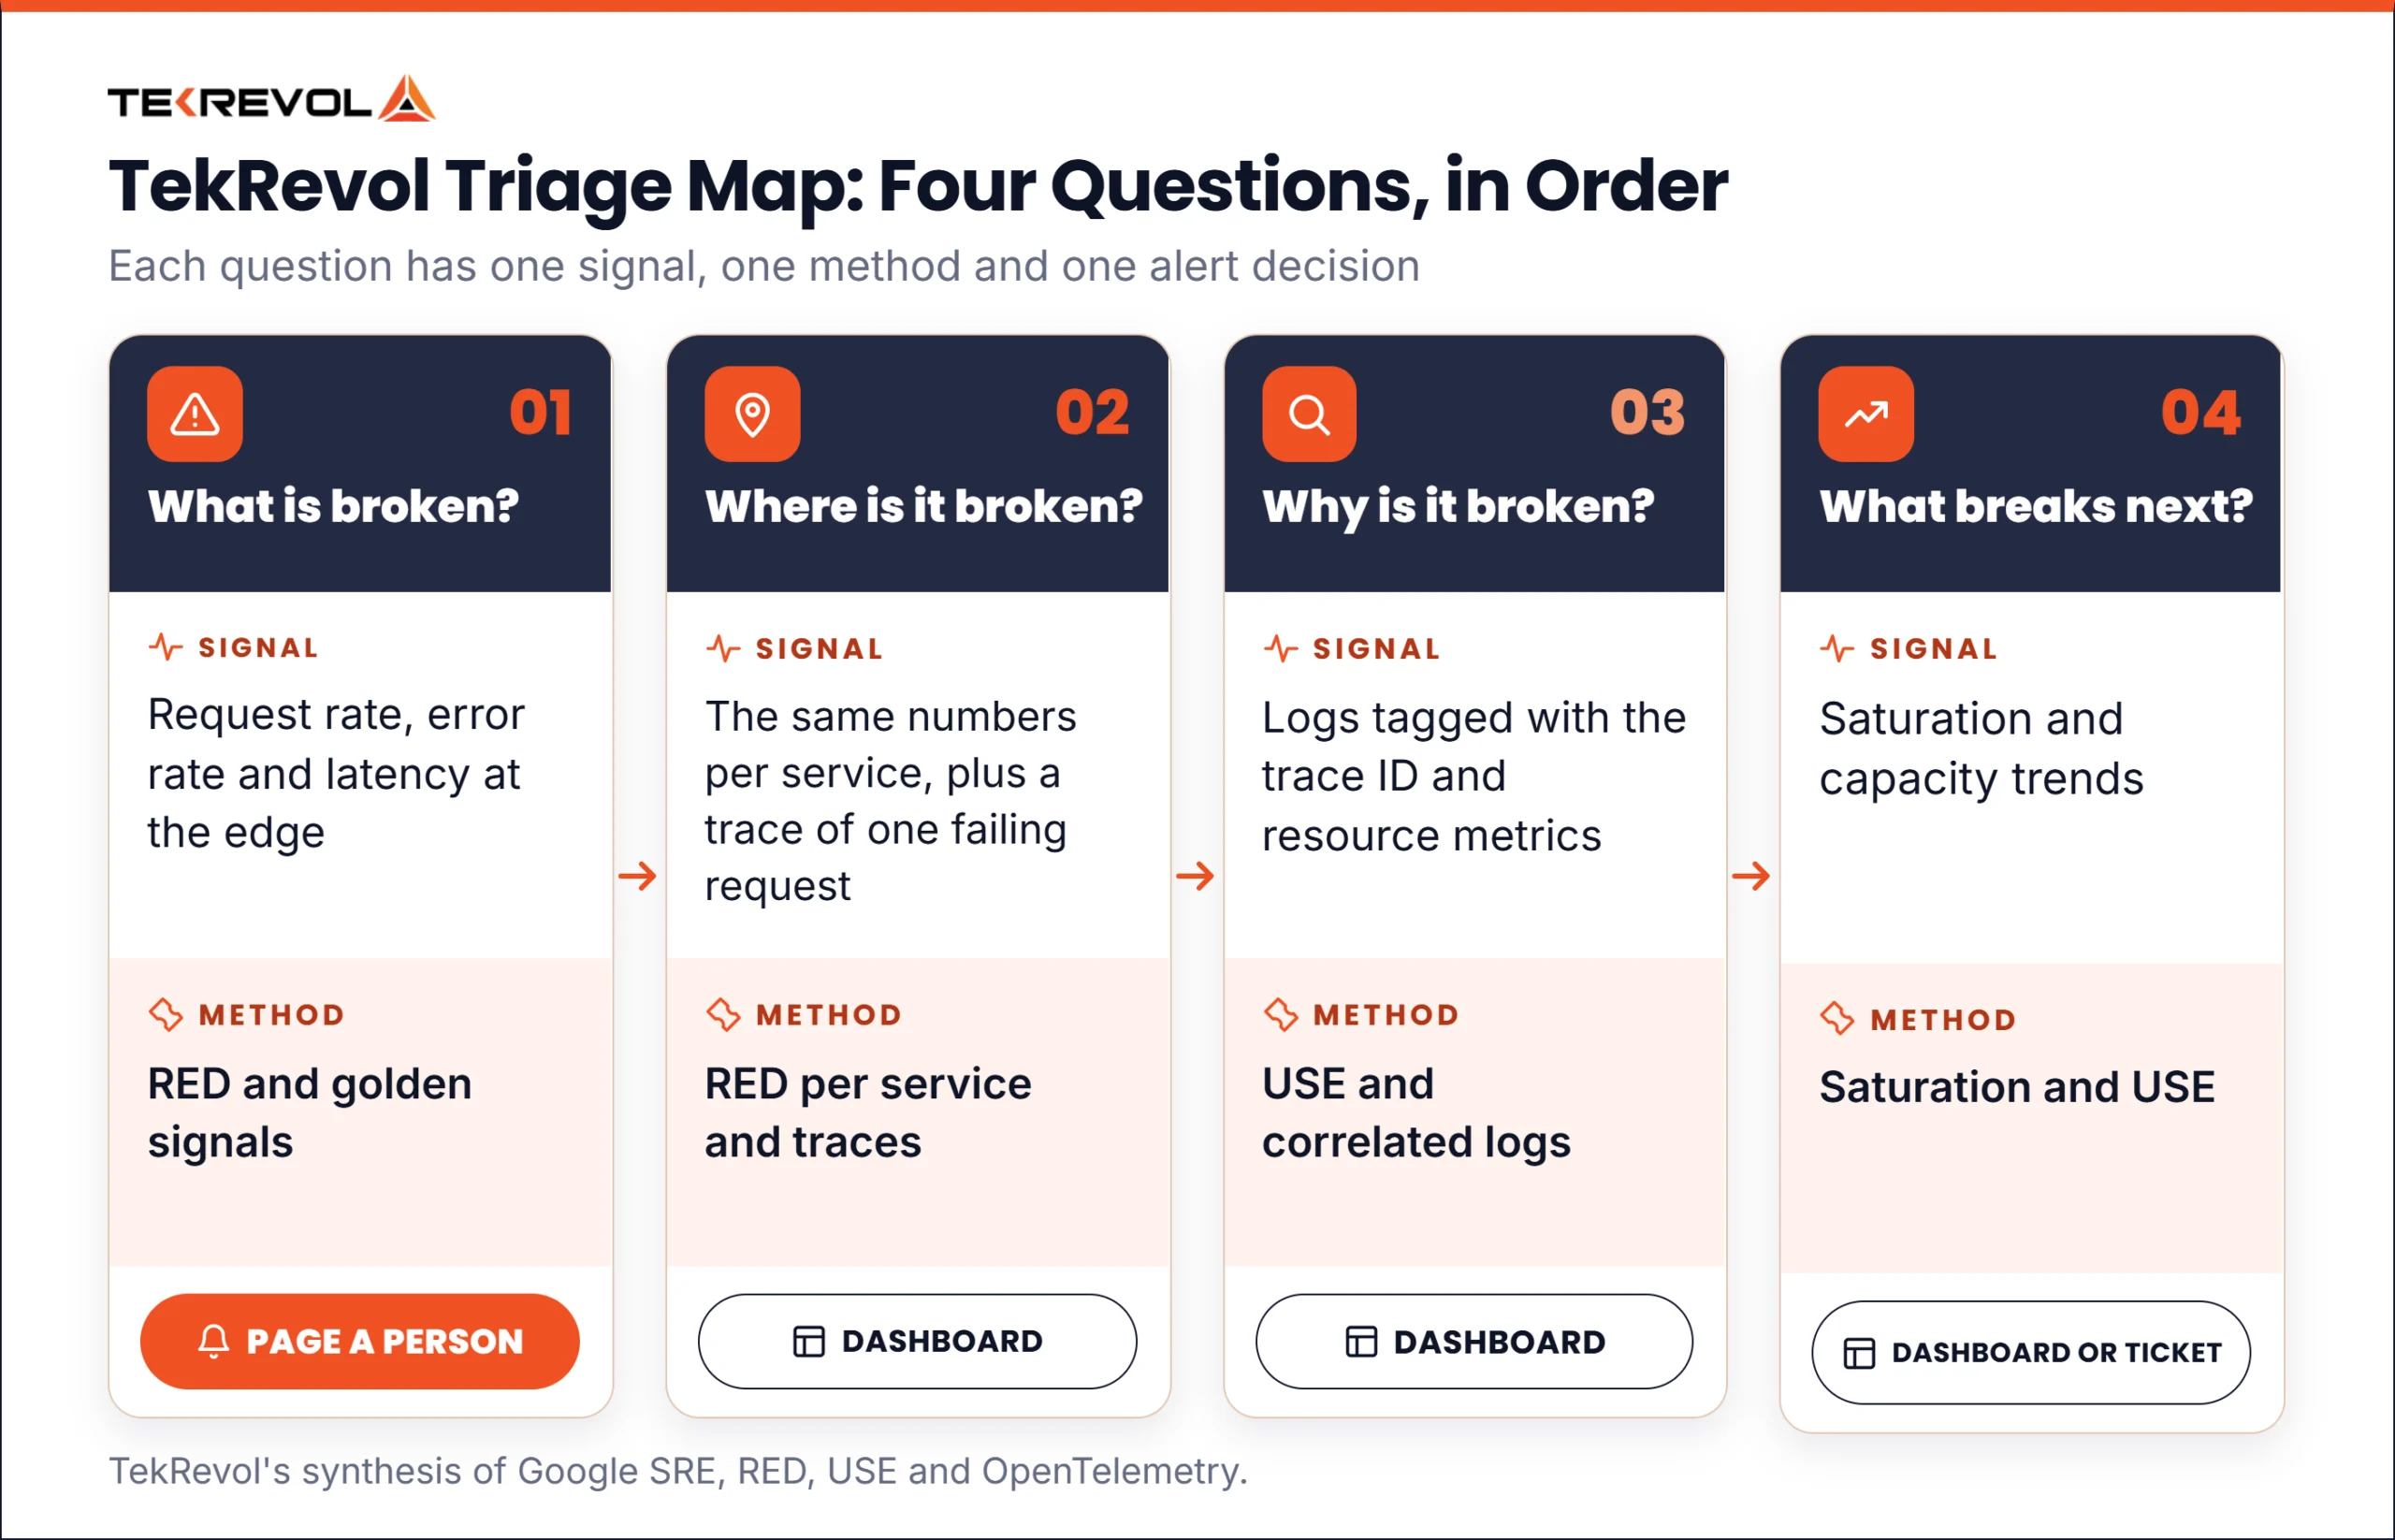
TekRevol presents the map as judgment. It draws on four public sources: Google’s SRE book for the split between symptoms and causes, Tom Wilkie’s RED method, Brendan Gregg’s USE method, and OpenTelemetry for trace context.
| Question | Signal that answers it | Method | Page or dashboard |
| 1. What is broken? | Request rate, error rate, and latency at the edge of the system | RED and golden signals | Page a person |
| 2. Where is it broken? | The same numbers per service, plus a trace of one failing request | RED per service and traces | Dashboard, linked from the page |
| 3. Why is it broken? | Logs tagged with the trace ID, plus resource metrics for the failing service | USE and correlated logs | Dashboard |
| 4. What breaks next? | Saturation and capacity trends | Saturation from the golden signals, and USE | Dashboard or ticket |
This is an illustrative scenario. Checkout pages slow down. Question 1 shows duration rising at the edge while errors stay flat. The 2nd question shows the slowdown starting in the payment service, because a trace of one slow checkout spends most of its time in that service. Question 3 finds repeated database retries in the logs tagged with that trace, and the resource metrics show a full connection pool. Question 4 turns that saturation into a ticket to raise the pool limit before the next traffic peak.
How to monitor microservices: the metrics that tell you what is broken
Measure rate, errors, and duration for every service, and add saturation for the resources behind it. Google’s SRE book names four golden signals: latency, traffic, errors, and saturation. It advises measuring the latency of failed and successful requests separately, because a fast error can look like good performance. It counts three kinds of error: explicit, implicit, and set by policy.
Tom Wilkie created the RED method in 2015 for request-handling services, and Grafana Labs reported it in 2018. Brendan Gregg’s USE method, first published in 2012, checks utilization, saturation, and errors for each resource. Wilkie recommends using both. Prometheus’s instrumentation guidance agrees on the basics for request-serving systems: count requests and errors, and time each request. It adds that a failure counter should sit beside a total-attempts counter.
| Method | Origin | What it measures | Applies to |
| Four golden signals | Google SRE book | Latency, traffic, errors, saturation | A user-facing service |
| RED | Tom Wilke, 2015 | Rate, errors, duration | Each request-serving service |
| USE | Brendan Gregg, 2012 | Utilization, saturation, errors | Each resource |
How does distributed tracing follow a request across services?
Following one request across services works by passing a trace ID and a span ID in every service call. OpenTelemetry’s context propagation documentation calls this context propagation. When service A calls service B, A sends its trace ID and span ID in the request. B reads them, starts its own span in the same trace, and records A’s span as the parent.
The W3C Trace Context standard defines the format, usually a traceparent HTTP header. OpenTelemetry uses it by default, and its instrumentation libraries usually pass the context along automatically.
How do logs and health checks fit in?
Structured logs that carry the trace ID let a team jump from a slow trace to the exact log lines behind it. OpenTelemetry says logs can be automatically correlated with a trace and span by adding their IDs. The microservices best practices guide covers the matching correlation ID. In TekRevol’s judgment, microservices logging should favor the events that help answer the four Triage Map questions.
A health check is a small endpoint or command that reports whether one instance is alive and able to take traffic. The Kubernetes documentation says the kubelet runs probes that track the health of containers. In TekRevol’s judgment, keep each check cheap and separate from business endpoints, so a slow check cannot slow real requests.
What should page a person, and what should stay on a dashboard?
Page a person only for symptoms that users feel and that need action now, and send everything else to a dashboard. That rule comes from the Google SRE book. It says paging is expensive and too many pages teach people to ignore them, so each page should be urgent, actionable, and need human judgment. It also separates symptoms from causes: alert on what users see, and use causes mainly for debugging.
Black-box monitoring tests behavior as a user would see it, and the book says it suits paging. White-box monitoring reads internal metrics and logs, and it suits debugging. The book adds that email alerts tend to turn into noise, and that a dashboard serves lesser problems better.
Tie alerts to a service level objective (SLO) when you can. OpenTelemetry describes an SLO as how reliability is communicated, by attaching service level indicators to business value.
How do you keep telemetry cost under control?
Telemetry cost grows with the traces you keep and the label combinations on each metric, so cap both on purpose. OpenTelemetry’s sampling guidance calls sampling one of the most effective ways to cut observability cost while keeping data representative, and says high-volume systems may need a rate of 1% or lower. It gives two separate reasons to sample: a volume of 1,000 or more traces per second, and mostly healthy traffic. Either can justify sampling. It advises against sampling when a system produces very little data or when regulation forbids dropping it.
Head sampling decides at the start of a request, using the trace ID and a target percentage, so it cannot filter by how the request turned out. Tail sampling decides after the trace finishes, so it can keep errors and slow traces. A 2022 OpenTelemetry post, which says it may be outdated, lists the costs: memory to hold spans, a requirement that all spans of a trace reach one collector, and spans lost when they arrive late.
For metrics, Prometheus’s guidance says each unique label combination creates a new time series that costs memory, CPU, disk, and network. It warns against label values that grow with users or items. It calls keeping cardinality below 10 a general guideline for metrics, and says metrics above 10 should be limited to a handful across the whole system.
How to choose a monitoring tool for microservices
Choose a tool by what it must do for your services. Check four things: whether it accepts OpenTelemetry data, whether it correlates traces, metrics, and logs, whether it lets you control sampling and cardinality, and what it costs at your data volume. These checks are TekRevol’s judgment, and they overlap with the criteria in the Redis guide.
Microservices monitoring tools fall into four groups. The tools are not ranked. The examples come from the guides listed above, and the selection, strengths, and trade-offs are TekRevol’s judgment.
| Group | Examples named in vendor guides | Strength | Trade-off |
| Open-source metrics | OpenTelemetry, Prometheus, Grafana | Control over your data | Your team runs the stack |
| Open-source tracing | Jaeger, Zipkin | Built for request paths | Needs metrics and logs elsewhere |
| Commercial platform | Datadog, Dynatrace, New Relic | One product for all signals | Cost can rise with data volume |
| Cloud-provider native | Amazon CloudWatch (named by Dash0) | Close to your cloud services | Ties you to one cloud |
Where should a team start?
A team with a handful of services can start with four steps, in the order of the Triage Map.
- Measure rate, errors, and duration at the edge, and page on errors and latency.
- Pass trace context between every pair of services.
- Add the trace ID to every log line and send the logs to one place.
- Add saturation to the dashboards for each service’s resources, and ticket the trends.
This order is TekRevol’s judgment. A team that has not yet split its application can first read how microservices architecture divides it into services.
Get help setting up monitoring for your microservices
A monitoring setup works best when the team plans it with the architecture, before the first service ships. TekRevol, a software development company, offers cloud consulting services that include monitoring and optimization using tools like Prometheus and Grafana, along with the development of containerized microservices. If you are planning or running a system built from many services, bring your answers to the four Triage Map questions to a conversation with our team. Start with a Free Consultation.