Facebook stats and facts for 2025 prove the platform isn’t slowing down anytime soon.
With over 3.065 billion monthly active users and more than 2.11 billion daily users, Facebook remains the largest social media network worldwide. That’s nearly 40% of the entire global internet population checking in monthly, according to Meta’s latest quarterly report.
But it’s not just about how many users Facebook has today anymore. The platform has evolved into a full-scale ecosystem that supports video content, community groups, marketplace listings, and business tools.
Whether you’re a marketer, entrepreneur, or content creator, understanding these Facebook stats can help you navigate where your audience lives, what content they engage with, and how your brand can stay competitive.
In this blog, we’ll break down the most relevant Facebook trends for 2026, backed by real numbers and insights that matter. Let’s get started with what the data is telling us this year.
How Many People Use Facebook in 2026? [Global Facebook Stats & Facts]
As of 2026, Facebook has 3.065 billion monthly active users worldwide, up over 70 million from last year. The platform is still growing steadily and remains one of the most-used social media platforms by users globally.
Facebook continues to dominate the digital landscape, with nearly 4 in 10 people of the global internet population using the app monthly. But it’s not just passive scrolling; users actively engage through Facebook Live, Marketplace, Reels, and Groups.
Quick Fact Check:
Facebook’s monthly user base has grown by over 70 million since 2025, reinforcing its grip as the most-used social media app on the planet.
But what does this mean for you?
If you are running ads, managing a Facebook Page, or even just posting casually, these Facebook stats show you’re not talking into the void. You are reaching real people, a global scale.
Which Regions Have the Most Facebook Users? [2026 Facebook Stats by Country]
If you have wondered how popular Facebook is worldwide, looking at where its users live gives a clear answer. In 2026, the largest Facebook user base is in Asia, led by India with over 450 million users.
Other top regions include North America, Latin America, and Southeast Asia, where usage remains high and continues to grow.
Different regions show different levels of Facebook activity. Some with huge user bases, others are still growing. Let’s explore which parts of the world have the highest number of Facebook users.
Regional Distribution of Facebook Users
Most of Facebook’s users come from the Asia-Pacific region, with Europe, Latin America, and North America following behind.
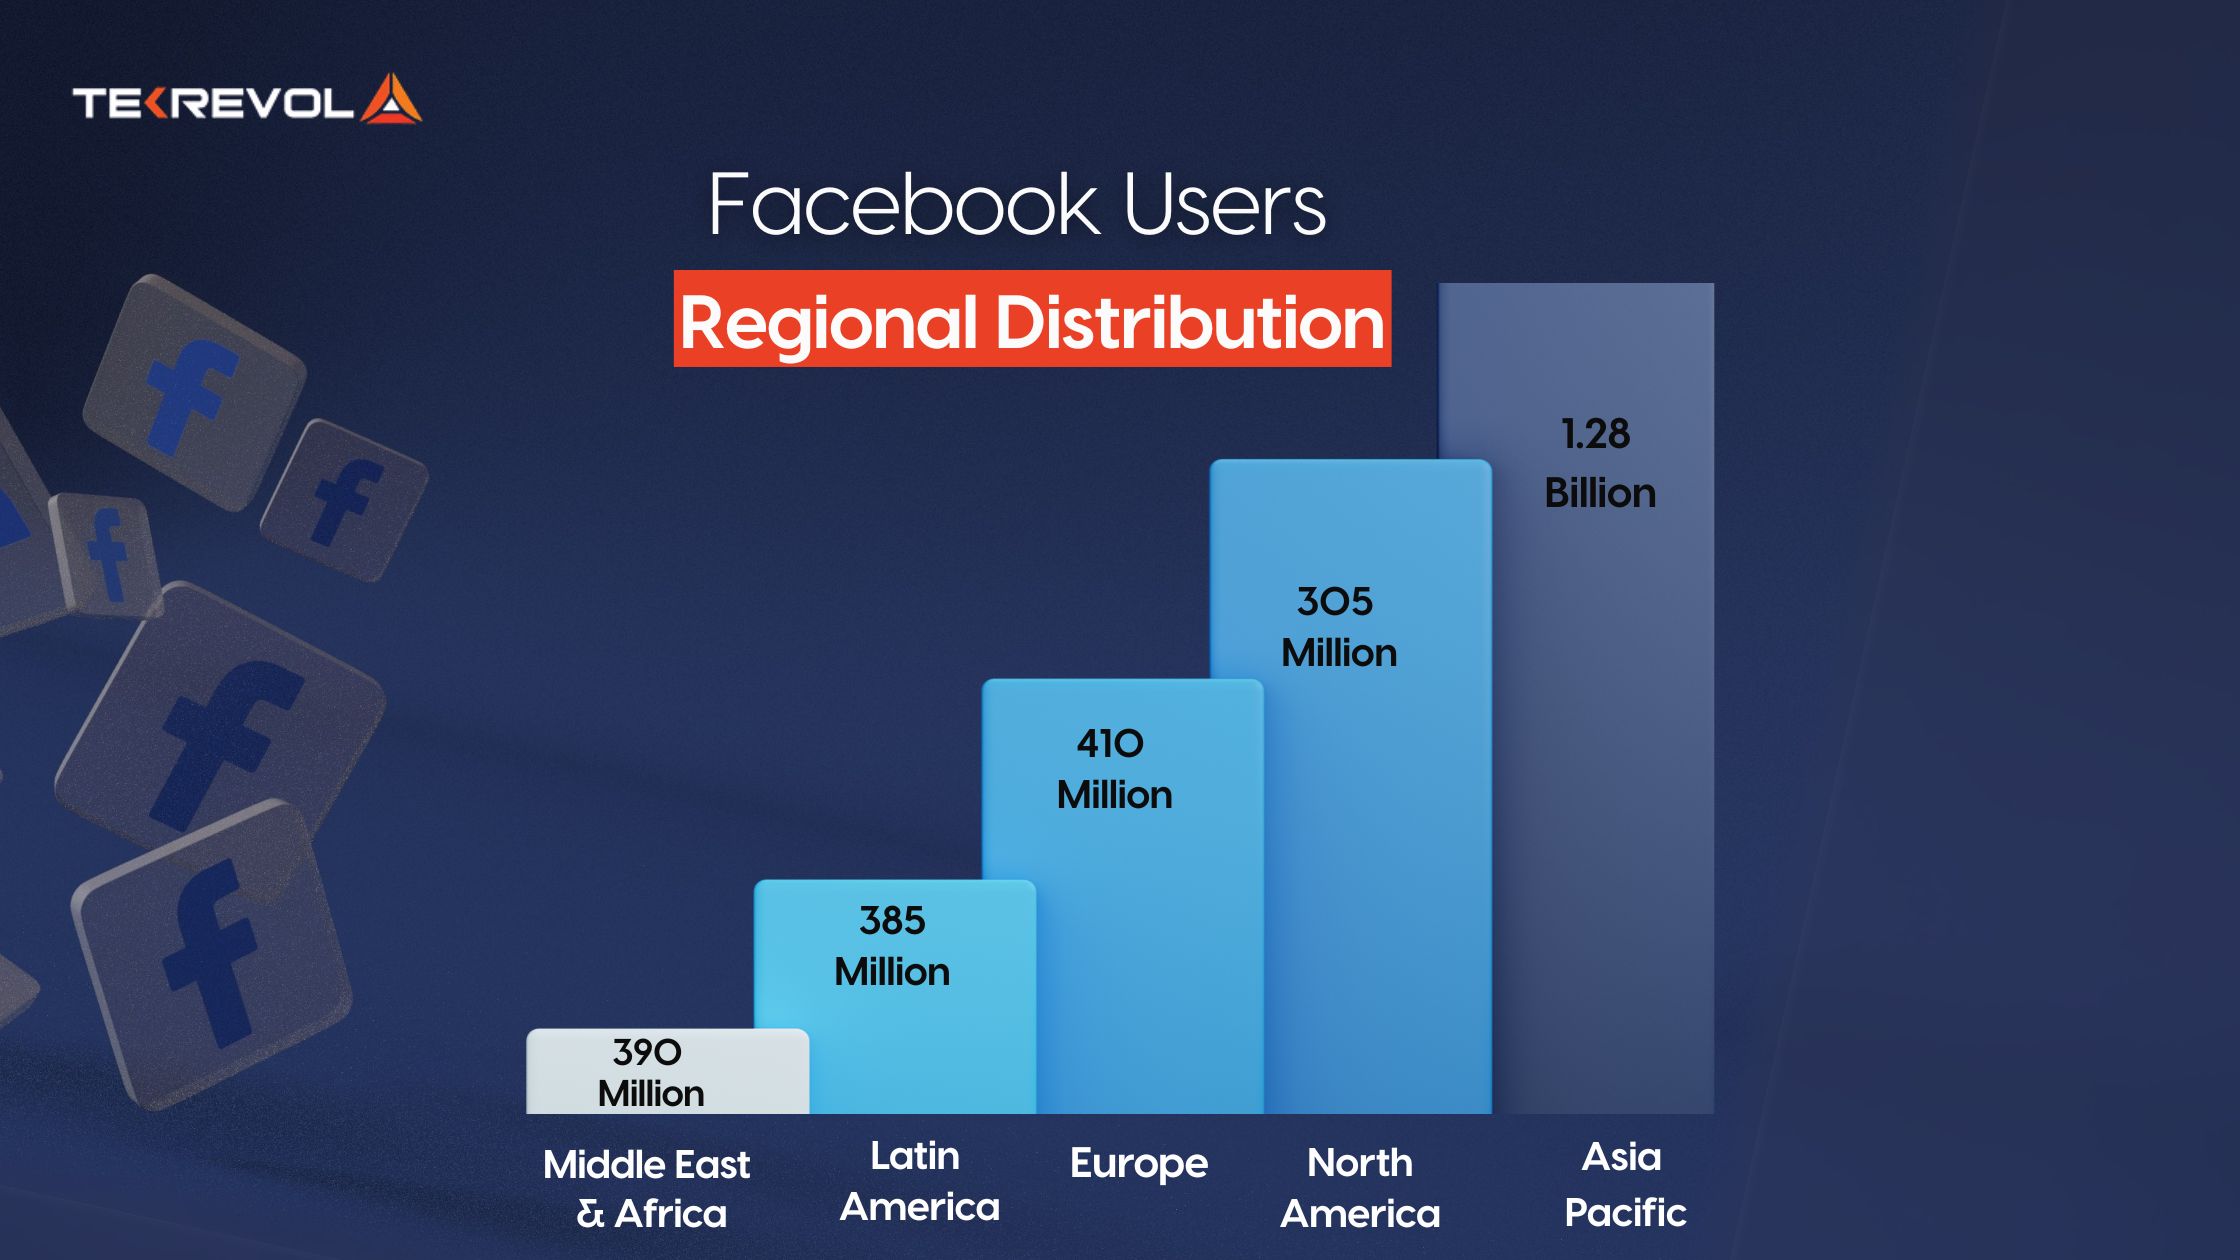
Here is how many subscribers Facebook has across key regions:
| Region | Users (millions) | Share of Global Users |
| Eastern Asia | 309 | 13.6% |
| South-Eastern Asia | 472 | 20.8% |
| Southern Asia | 560 | 24.6% |
| Central Asia | 20.3 | 0.9% |
| Western Asia | 102 | 4.5% |
| Northern America | 221 | 9.7% |
| Central America | 120 | 5.2% |
| Caribbean | 13.8 | 0.6% |
| Southern America | 257 | 11.3% |
| Western Europe | 77.0 | 3.4% |
| Northern Europe | 59.6 | 2.6% |
| Southern Europe | 71.1 | 3.1% |
| Eastern Europe | 61.3 | 2.7% |
| Northern Africa | 110 | 4.8% |
| Western Africa | 74.7 | 3.3% |
| Middle Africa | 21.1 | 0.9% |
| Eastern Africa | 55.5 | 2.4% |
| Southern Africa | 29.8 | 1.3% |
So, if you are wondering how many people are on Facebook, the answer is not just “a lot.” It is more like: most of the internet.
Facebook Usage by Country: Top 10 Markets
As per Facebook stats by country, here is a snapshot of the top 10 markets:
| Country | Users (in millions) |
| India | 410 |
| United States | 245 |
| Indonesia | 125 |
| Brazil | 113 |
| Mexico | 92 |
| Philippines | 83 |
| Vietnam | 78 |
| Bangladesh | 69 |
| Pakistan | 65 |
| Egypt | 60 |
India holds the crown by far, followed by the US, where Facebook remains the dominant social network despite the rise of TikTok and Snapchat.
Latin America and Southeast Asia continue to show strong user growth, especially in mobile-first economies.
Facebook Downloads Statistics
Despite being one of the oldest apps on the market, Facebook remains one of the most downloaded apps globally in 2025, with over 100 million new downloads in the past year alone.
Mobile usage continues to dominate, with nearly 98% of users accessing Facebook via smartphones. New downloads come from device upgrades, emerging markets, and alternative versions like Facebook Lite, which is especially popular in regions with limited data access.
Facebook App Downloads by Version
Not all Facebook apps are used the same way. The main app still leads, but other versions have their own following.
So, below is an overview of how many downloads Facebook has by version.
| App Version | Total Downloads | Notes |
| Facebook (Main) | 5+ billion (Android) | Most downloaded social app ever |
| Facebook (iOS) | 2.3 billion | Strong in the US, UK, and Europe |
| Facebook Lite | 1+ billion | Preferred in low-data regions |
| Combined Total | 8.3+ billion | Including updates and re-installs |
Rise of Facebook Lite
In countries like Nigeria and India, Facebook Lite ranks among the top apps on Android due to its low data consumption. Meanwhile, in Western markets, users re-download Facebook when switching devices or reinstalling after temporary deactivation.
Here’s the scoop on how many active users on Facebook Lite there are today.
- 200+ million monthly active users
- Especially strong in India, Africa, and Southeast Asia
- Uses 90% less data than the main app
Mobile Traffic Dominance
Let’s not ignore the obvious: Facebook is a mobile-first platform with 98.5% of traffic coming from mobile.
Only 1.5% of Facebook traffic comes from desktops in 2025, meaning brands need to optimize everything for smartphones.
From Facebook Shops to Reels, the mobile experience is where the action is.
- Want an app as lean as Facebook?
- At TekRevol, we design mobile experiences that scale globally
Facebook Demographics Statistics 2026
Facebook might not dominate headlines like TikTok or Instagram, but it quietly maintains the most diverse and committed user base in the world.
Age Distribution
Despite what Gen Z might say, Facebook isn’t a ghost town. The platform’s largest demographic is made up of millennials and early Gen X:
According to Facebook stats, young adults now represent around 15% of the user base.
| Age Group | % of Users |
| 25–34 | 32% |
| 35–44 | 20% |
| 18–24 | 15% |
| 45–54 | 15% |
| 55–64 | 10% |
| 65+ | 8% |
Gender Distribution: Balanced and Consistent
Facebook’s gender split in 2025 is close to even, with a slight edge to females (52%) compared to 48% male users:
According to Meta’s January 2026 ad audience data, the age distribution breaks down as follows, split by gender:
| Age Group | Female (%) | Male (%) |
| 18-24 | 9.1 | 12.7 |
| 25-34 | 12.7 | 18.5 |
| 35-44 | 8.7 | 11.7 |
| 45-54 | 5.7 | 6.6 |
| 55-64 | 3.9 | 4.0 |
| 65+ | 3.4 | 3.0 |
This balance makes Facebook a reliable platform for businesses targeting diverse demographics in almost every vertical. From fashion and retail to SaaS and education, they reach their audience without demographic bias.
Facebook Engagement Metrics
With dozens of apps competing for attention, it is easy to assume the app is fading. But Facebook stats say otherwise. Users aren’t just logging in; they are staying engaged.
Time Spent on Facebook
Facebook users spend an average of 35 minutes per day on the platform in 2025, slightly lower than its peak years but still significant.
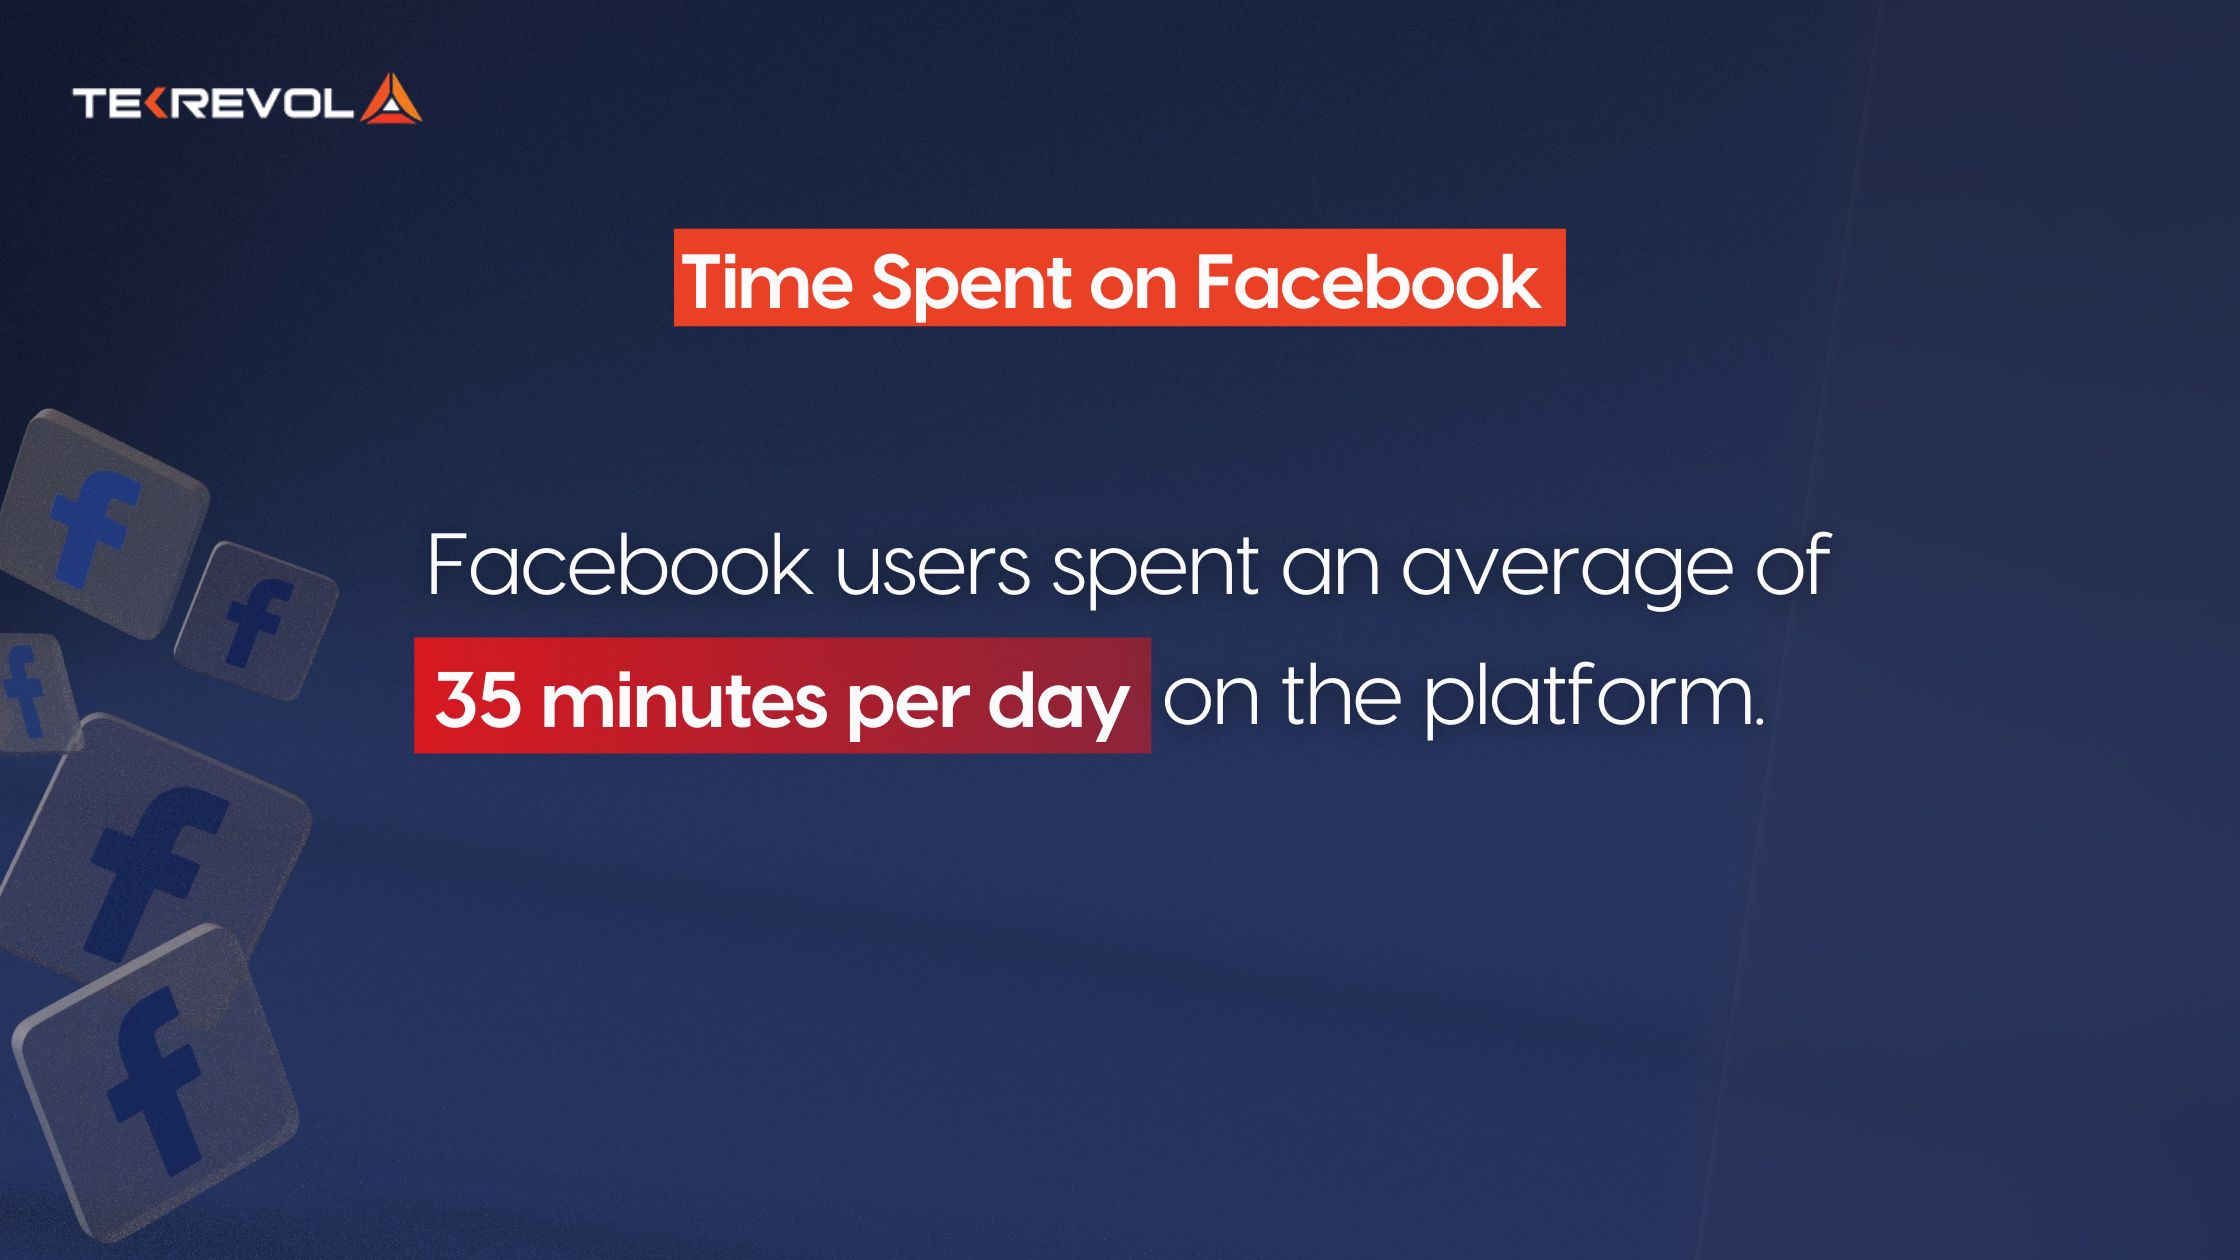
- Daily average per user: 35 minutes
- Top-engaged group (25–34) spends over 40 minutes
- Scroll habits peak in the evening and during commutes
Most Engaging Content Formats
On Facebook, nothing stops the scroll quite like video content.
Whether you are a casual user, a brand, or a content creator, one thing is clear: Video leads the way when it comes to capturing attention.
Here is a quick look at what performs best:
- Short videos (under 2 mins) → Great for retention and easy shares. These bite-sized clips often get the highest completion rates.
- Facebook Live → Perfect for live Q&As, product launches, and events. Live videos see 6x more engagement than regular ones.
- Image-heavy posts → These get 80% more interactions than plain text. Think photo albums, infographics, or quote cards.
Top Content Formats by Industry
Understanding which content formats resonate with your target audience can significantly impact engagement and sales.
So, have a look at top-performing content formats by industry:
| Industry | Top Content Format | Notes |
| Beauty | Reels | Engaging short videos showcase products |
| Art & Design | Image Carousels | Visual storytelling captures audience interest |
| Retail | Dynamic Product Ads | Personalized ads drive higher conversions |
| SaaS | Educational Videos | Informative content builds trust and authority |
Best Times to Post on Facebook for Maximum Reach
To improve visibility, align your posts with these usage peaks:
| Day | Peak Time (Local) |
| Weekdays | 8:00 AM – 9:00 AM |
| Weeknights | 6:00 PM – 8:00 PM |
| Saturdays | 10:00 AM – 12:00 PM |
Avoid weekday afternoons’ engagement dips as users switch to passive scrolling.
- Struggling With App Engagement?
- Let us audit your current strategy to find what’s holding you back.
Facebook Video & Story Stats
Facebook isn’t just for scrolling photos or event invites. In 2025, it is all about the videos. From short clips to livestreams and daily Reels, video content has taken center stage.
Here is how Facebook’s video game is playing out around the world.
Short Video Performance
Short videos are Facebook’s sweet spot right now. People love quick, snackable content they can watch on the go, and Facebook is serving billions daily.
| Metric | Stat (2025) |
| Daily Reels views | 140 billion+ |
| Short-form video ad revenue share | Over 50% of Facebook’s total ads |
| % of video ads under 30 seconds | 66% |
No surprise here! The shorter the clip, the faster people hit that like, comment, or share button.
Facebook Live & Reels
While short videos grab attention, Live and Reels keep people sticking around.
Whether it is a Q&A, behind-the-scenes moment, or quick reel recap, these formats are driving serious engagement.
Here is what’s trending:
- Facebook Live racked up 32.6 million monthly watch hours in the past year.
- Reels aren’t just for Instagram. Big Facebook pages (50 K+ followers) see a 2.18% engagement rate on them.
- And guess what? Over half of young adults now watch Reels daily on Facebook.
Live content builds trust, while Reels deliver entertainment in under a minute; the perfect combo.
Daily Video Consumption on Facebook
If you have opened Facebook today, chances are you’ve watched at least one video. That’s how dominant video is now.
| Behavior | Stat |
| Total daily video views | 8 billion+ |
| Video views on mobile | 90%+ |
| Videos watched without sound | 85% |
Facebook Stats for Business
Though Facebook is still a top platform for businesses in 2025, the rules have changed. There was a time when you could post on your Page and watch the likes, comments, and clicks roll in.
But those days are long gone. Today, relying solely on organic reach feels like whispering into a storm. Paid reach? That is where brands are seeing real momentum.
Let’s break down how organic performance has shifted and why paid distribution has become essential.
Organic vs. Paid Reach
Back in 2012, businesses reached about 16% of their followers organically. In 2025? It is down to 2.2% or less for bigger pages.
The reason: Facebook’s News Feed now favors posts from friends and family over brands. Organic content is deprioritized unless it drives meaningful interaction.
That’s why more marketers are shifting to paid ads:
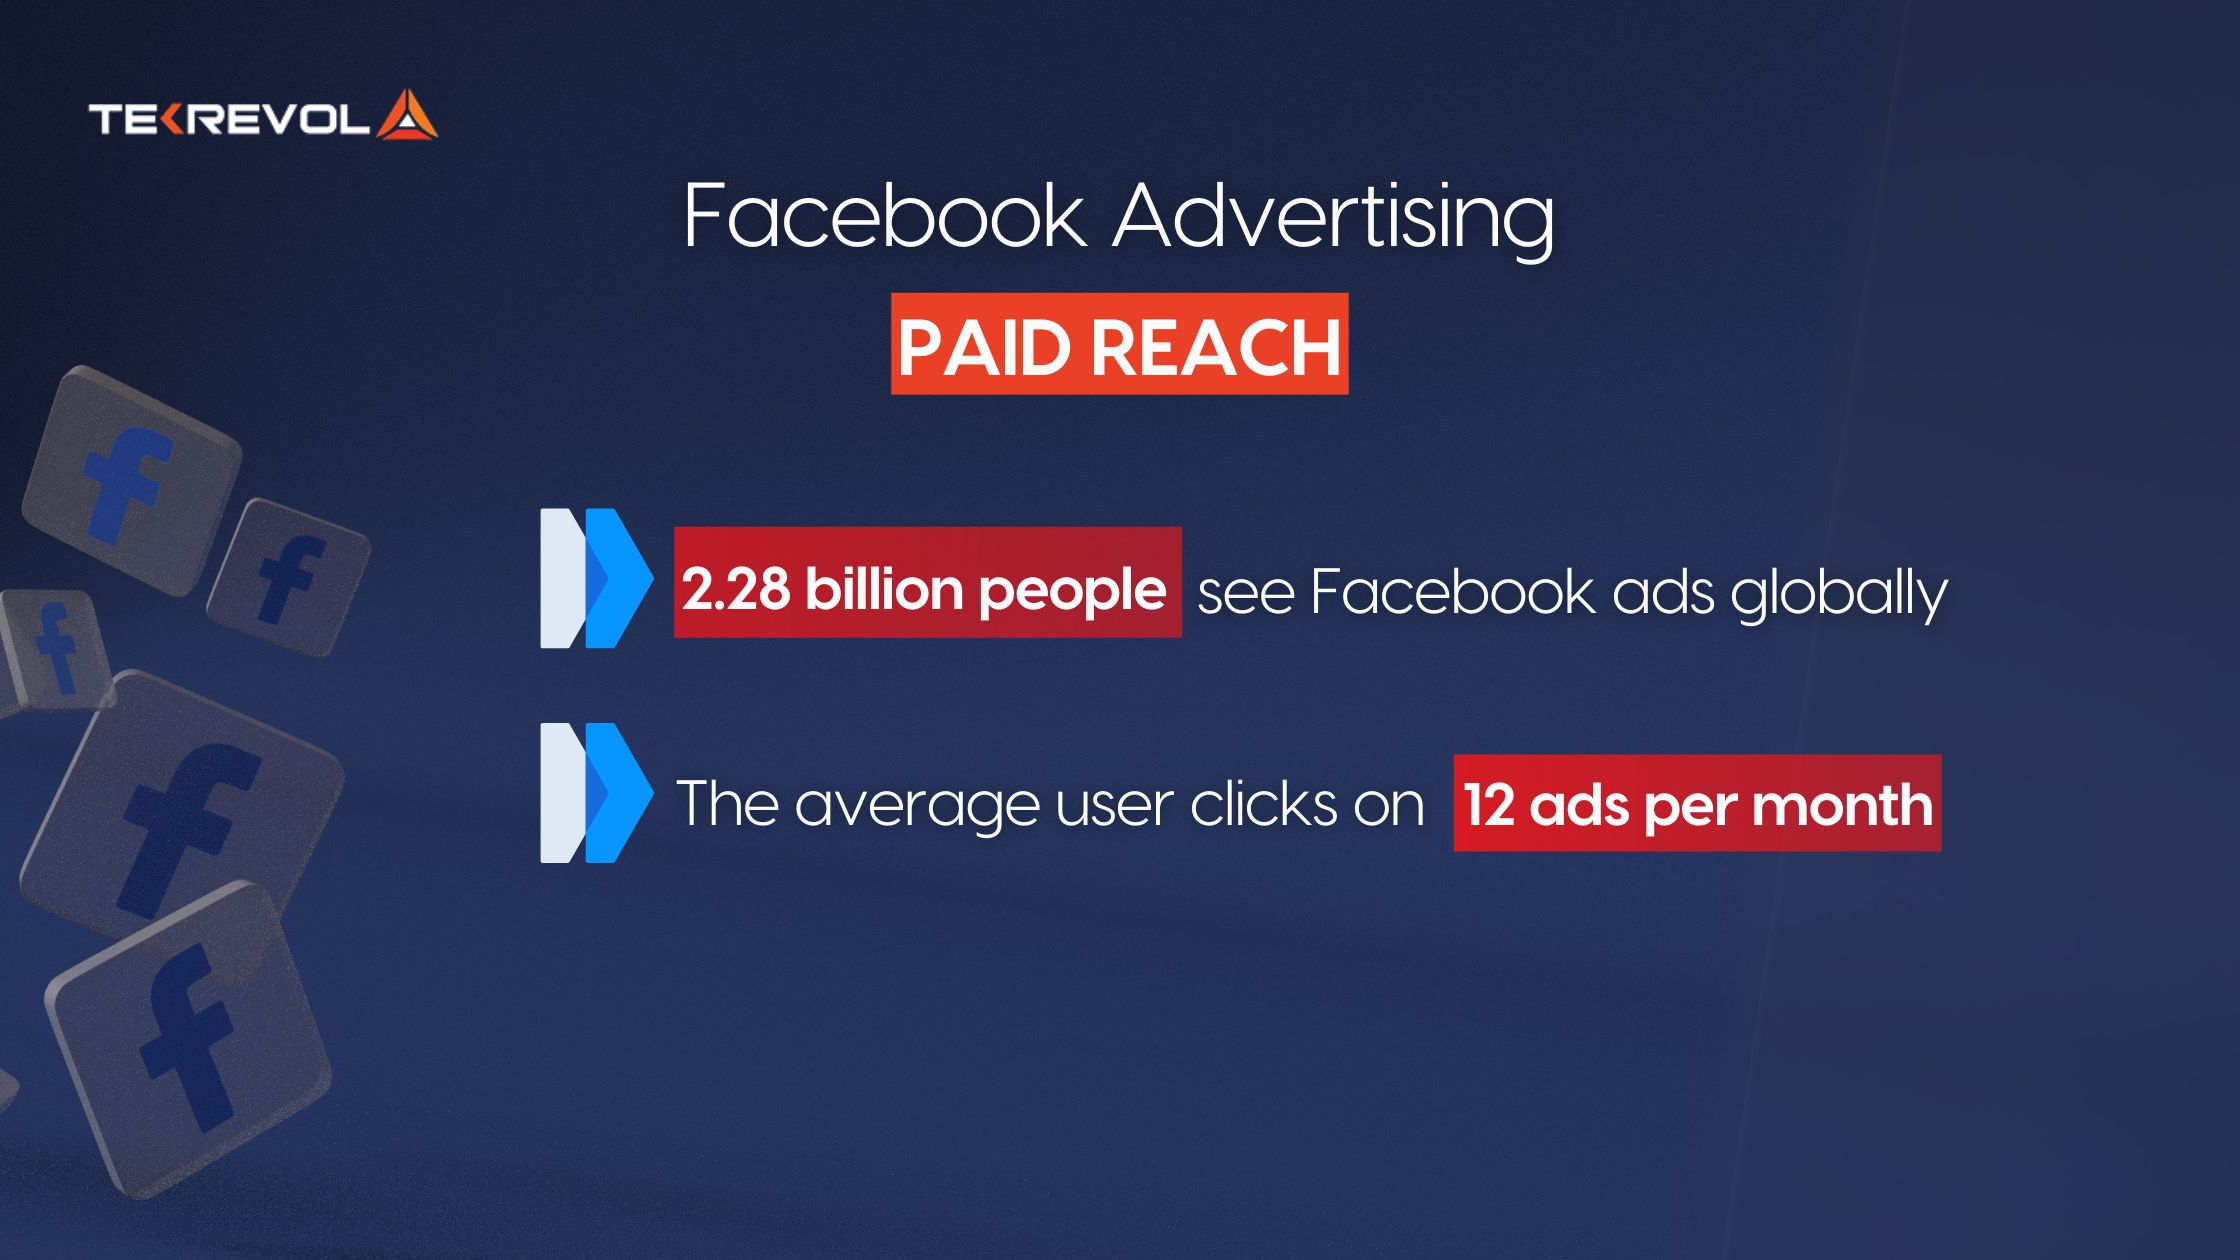
- 2.28 billion people see Facebook ads globally.
- The average user clicks on 12 ads per month.
In short, Facebook is now a pay-to-play game, but smart marketers can still win big with targeted creatives and lean budgets. Moreover, with initiatives like Facebook’s cryptocurrency, the platform is opening new doors for businesses to connect, transact, and grow.
Facebook Ad Performance (CTR, CPC, ROI)
Thanks to AI-powered targeting and real-time optimization, Facebook ads have become more sophisticated. Businesses are now leveraging detailed targeting to improve performance metrics.
Here’s a snapshot of average ad performance across various industries as per the Meta Ads Benchmark Report 2024:
| Industry | Avg. CTR (%) | Avg. CPC ($) | Avg. CVR (%) | Avg. CPA ($) |
| Real Estate | 2.60 | 0.65 | 9.70 | 13.87 |
| Restaurants & Food | 2.19 | 0.51 | 4.03 | 20.12 |
| Beauty & Personal Care | 1.51 | 0.94 | 5.93 | 42.10 |
| Finance & Insurance | 0.85 | 1.05 | 5.98 | 38.09 |
| Education & Instruction | 1.21 | 0.77 | 8.49 | 31.82 |
Top Performing Facebook Ad Types (2026)
Not all Facebook ads are created equal; some formats are stealing the spotlight.
From swipe-worthy carousels to scroll-stopping Reels, here is what’s driving clicks and conversions this year
| Ad Type | Strengths |
| Reels Ads | High reach + trending format |
| Carousel Ads | Showcase multiple products in one swipe |
| Video Ads | Best for engagement and storytelling |
| Dynamic Product Ads | Personalized retargeting at scale |
Facebook Shops & Marketplace Insights
Over 300 million users interact with Facebook Shops each month. And with 1.2 billion active on Marketplace, it is more than just a listing platform, a shopping ecosystem.
Native checkout, product tagging, and in-stream video shopping make it easy for brands to connect with purchase-ready audiences.
Plus, the integration of eBay listings into Facebook Marketplace in select regions has expanded product offerings and enhanced user experience.
It’s why Facebook remains one of the essential social media apps for your business to rely on, alongside platforms like Instagram and LinkedIn, for end-to-end customer journeys.
Facebook Page Statistics
Still wondering if Facebook Pages are worth the effort in 2025? Spoiler: they are.
Whether you’re running a small side gig, a growing startup, or a global brand, Pages remain one of the most reliable tools for reach, engagement, and traffic.
With 3.05 billion monthly active users today (yes, that’s how many Facebook members there are), the potential audience is massive, and business pages are taking full advantage.
Here’s why Facebook Pages continue to deliver real value:
- Pages show up in Google Search, boosting your brand’s visibility beyond Facebook.
- They allow direct messages via Messenger, helping brands connect 1-on-1 with customers.
- They integrate with Facebook Shops and Instagram, making cross-selling smooth and seamless.
Let’s break down how Facebook Pages are performing in 2026.
Key Page Metrics
Facebook Pages have evolved, but the fundamentals still matter: reach, engagement, and how often your audience sees your posts.
Here’s a quick snapshot of what the numbers say today.
| Metric | Value | Trend |
| Total Facebook Pages | 200+ million | Steady growth |
| Active Business Pages | 80+ million | More brands are going digital |
| Pages Using Facebook Ads | 10+ million | Increasing investment |
| Average Organic Reach/Post | 5.2% of Page followers | Gradual decline |
| Average Engagement Rate | 0.07% – 1.2% | Depends on the content type |
| Top-Performing Content Types | Short videos, carousels | Visual-first formats win |
And if you’re wondering where most of this traffic comes from, 97% of Facebook Page views happen on mobile.
Takeaway: Short-form videos and image carousels are winning the game. And while organic reach is shrinking, smart content still performs, especially when paired with paid boosts.
Traffic Driven by Pages
Even with all the algorithm changes, Facebook Pages still deliver traffic that matters. Think landing pages, product links, and eCommerce sites; Pages are quietly doing the heavy lifting for many businesses.
| Source | Type of Traffic | Notable Trends |
| Facebook Pages (Organic) | Site & link traffic | High intent from engaged followers |
| Facebook Ads via Pages | Paid traffic | Strong for lead gen & conversions |
| Posts with Links (Non-boosted) | Mixed traffic | Better when paired with strong visuals |
Pages work best when they combine strong visual content, smart link placement, and regular audience interaction. That means:
- Use short videos or live streams to increase visibility
- Ask questions or encourage comments
- Post when your audience is online (check Page Insights)
Facebook Messenger Stats
When we talk about Facebook traffic stats, a huge chunk comes from Messenger.
Wondered how many active users does Facebook have on Messenger. Well, it is a daily lifeline for more than 1.3 billion people worldwide, sending messages, making calls every month!
Every day, Messenger handles around 500 million video calls, with users spending an average of 30 minutes on the app.
Usage by Users
People use Messenger for everything. From quick check-ins and group chats to sharing moments, or hopping on video calls. It’s a go-to app for keeping in touch whenever, wherever.
On an average day, users exchange more than 20 billion messages. That’s a whole lot of chatting happening nonstop.
Messenger for Business
Businesses love Messenger too! Over 140 million businesses use it for customer chats. Messenger chatbots handle around 20 billion messages every month.
Following is a quick snapshot of some standout Facebook Messenger stats:
| Metric | Number |
| Monthly Active Users | 1.3 billion |
| Messages Sent Daily | 20 billion |
| Businesses Using Messenger | 140 million |
| Daily Video Calls | 500 million |
| Average Time Spent Daily | 30 minutes |
Facebook Stats vs Other Platforms (2025 Comparison)
Facebook might be the OG of social media, but it’s still very much in the game and playing to win.
Let’s break down how it competes with the rest of the social media crowd.
| Platform | Monthly Active Users (2026) |
| 3.05 billion | |
| YouTube | 2.5 billion |
| 2.3 billion | |
| 2.2 billion | |
| TikTok | 1.6 billion |
| Snapchat | 800 million |
| X (Twitter) | 615 million |
Despite the buzz around newer platforms like TikTok, Facebook continues to outperform most in both user volume and versatility.
It is a go-to channel for everything from connecting with friends to managing e-commerce storefronts and running high-conversion ad campaigns.
What sets Facebook apart is how it effortlessly combines chatting with friends and helping businesses grow. For many brands, it’s the main part of social media marketing that ties together their work on Instagram, LinkedIn, Pinterest, and more.
Latest Facebook Trends: What is New to Watch in 2026
Just when people start calling Facebook outdated, it finds a way to reinvent itself. By 2025, Facebook’s update feels smarter, more down-to-earth, and surprisingly hard to put down.
Here is a look at what’s changing and why it matters to users, creators, and brands.
Reels Are Ruling the Feed
If your Facebook feed feels a little more like TikTok lately, you’re not imagining it.
Reels have exploded, clocking over 200 billion plays a day. Yes, billion with a “B.”
Short-form video isn’t just a trend anymore; it’s the default. Brands that show up with casual behind-the-scenes clips, quick product demos, or UGC-style content are stealing the spotlight.
Want engagement? Reels are your best friend.
Less Broadcasting, More Bonding
Here’s a fun shift: Facebook’s turning more private.
Instead of shouting into the void with public posts, people are diving into Messenger groups, broadcast channels, and niche communities. There’s something cozier about it and a lot more effective for building loyalty.
Businesses are catching on, too. Instead of trying to go viral, they’re creating spaces where real conversations happen.
AI Is Playing a Bigger Role Behind the Scenes
Meta’s quietly adding AI tools that help you draft posts, trim long videos, and even pick the best time to publish.
And guess what? Posts shaped by these AI helpers are performing 18% better on average. It’s like having a content strategist in your pocket (without the hourly rate).
Metaverse Vision
Facebook’s parent company, Meta, is steadily building its metaverse platform, aiming to merge social media, gaming, work, and commerce into one immersive 3D environment — a vision expected to take shape in the coming years.
Shopping Got Smarter (and Smoother)
Facebook Shops just got an upgrade.
With AI-powered recommendations, real-time inventory syncing, and seamless checkout, buying through Facebook feels like scrolling through a smart, personal store.
US-based businesses using Shops are seeing 35% higher conversion rates compared to off-platform sales.
If you are selling online and ignoring Facebook? You might be leaving money on the table.
What’s Next for Facebook?
A few whispers from the grapevine suggest what might be coming:
- Audio might make a comeback; think mini-podcasts in your feed.
- AR shopping tools could let users try on glasses or makeup in real time.
- Facebook is even circling back to digital currency, as seen in its latest crypto initiatives.
All this to say, Facebook isn’t fading. It is evolving into something more layered, more interactive, and more useful than ever.
Why Choose Tekrevol for Facebook Marketing Success
Facebook marketing success demands more than just presence; it requires a strategy that drives real results.
At Tekrevol, we don’t just schedule content; we engineer strategies that drive real business outcomes.
From content planning to performance-driven campaigns, our social media marketing services are built to align with your business goals.
Whether you’re aiming for stronger brand presence, higher conversions, or viral engagement, we help your business cut through the noise and connect with the right audience.
- Ready to Turn Scrolls into Sales?
- We create a custom strategy for your brand for long-lasting growth.

![How Much Would It Truly Cost to Develop a Food Ordering Website? [2026 Analysis]](https://d3r5yd0374231.cloudfront.net/images-tek/uploads/2026/03/Tek-Feature-7-1.jpg)