



- App Store CRO means testing your icon, screenshots, video, and copy to boost app installs consistently.
- Conversion rate equals total downloads divided by unique product page views, multiplied by one hundred percent.
- There’s no universal good conversion rate; benchmarks vary widely by app category, platform, and traffic source.
- More traffic never fixes low conversion; the same percentage of visitors keeps leaving without downloading anything.
- Your app icon and first two screenshots influence downloads more than any other single listing element.
- ASO drives traffic to your app store page; CRO then converts that traffic into actual installs.
Your app store listing gets thousands of eyes on it every month, but how many of those glances actually turn into taps on “Get” or “Install”? For many app owners, the numbers are disappointing. The app might be good, but the listing isn’t giving users enough reason to download it.
This is exactly what App Store Conversion Rate Optimization solves: refining the elements users evaluate before downloading, like your icon, screenshots, preview video, title, description, and reviews, so more visitors turn into installs without needing more traffic. It’s a continuous cycle of testing, measuring, and improving based on real user behavior.
Many app owners turn to an ASO agency at this point because it’s not always easy to spot what’s costing them installs. An experienced team can find those gaps and turn a weak listing into one that consistently drives more downloads.
In this guide, we’ll break down how App Store conversion rate works, what a good rate looks like, which product-page elements matter most, how to test them, and how to diagnose a page that gets plenty of views but not enough downloads.
What Is App Store Conversion Rate Optimization?
App Store Conversion Rate Optimization (CRO) is the process of improving your app store listing to turn more visitors into downloads. It focuses on how many people install your app after viewing its page. By testing your visuals, copy, screenshots, and other listing elements, you can increase downloads without necessarily increasing traffic.
Think of the funnel like this:
Impressions → Product-page views → Downloads → Trials → Paid users
ASO helps you get discovered. App Store CRO helps you convert that attention into downloads.
The math behind it is simple:
Conversion Rate = (Downloads ÷ Page Views) × 100
If 1,000 people view your app page and 100 of them download it, your conversion rate is 10%. Simple. The hard part is moving that number up.
Quick distinction worth remembering: ASO gets people to your page. CRO gets them to tap download once they’re there. You need both, but they’re different jobs with different fixes.
How Is App Store Conversion Rate Calculated?
App Store conversion rate is calculated by dividing downloads by page views, but that single number hides three separate stages, and you need to understand all three to actually fix anything.
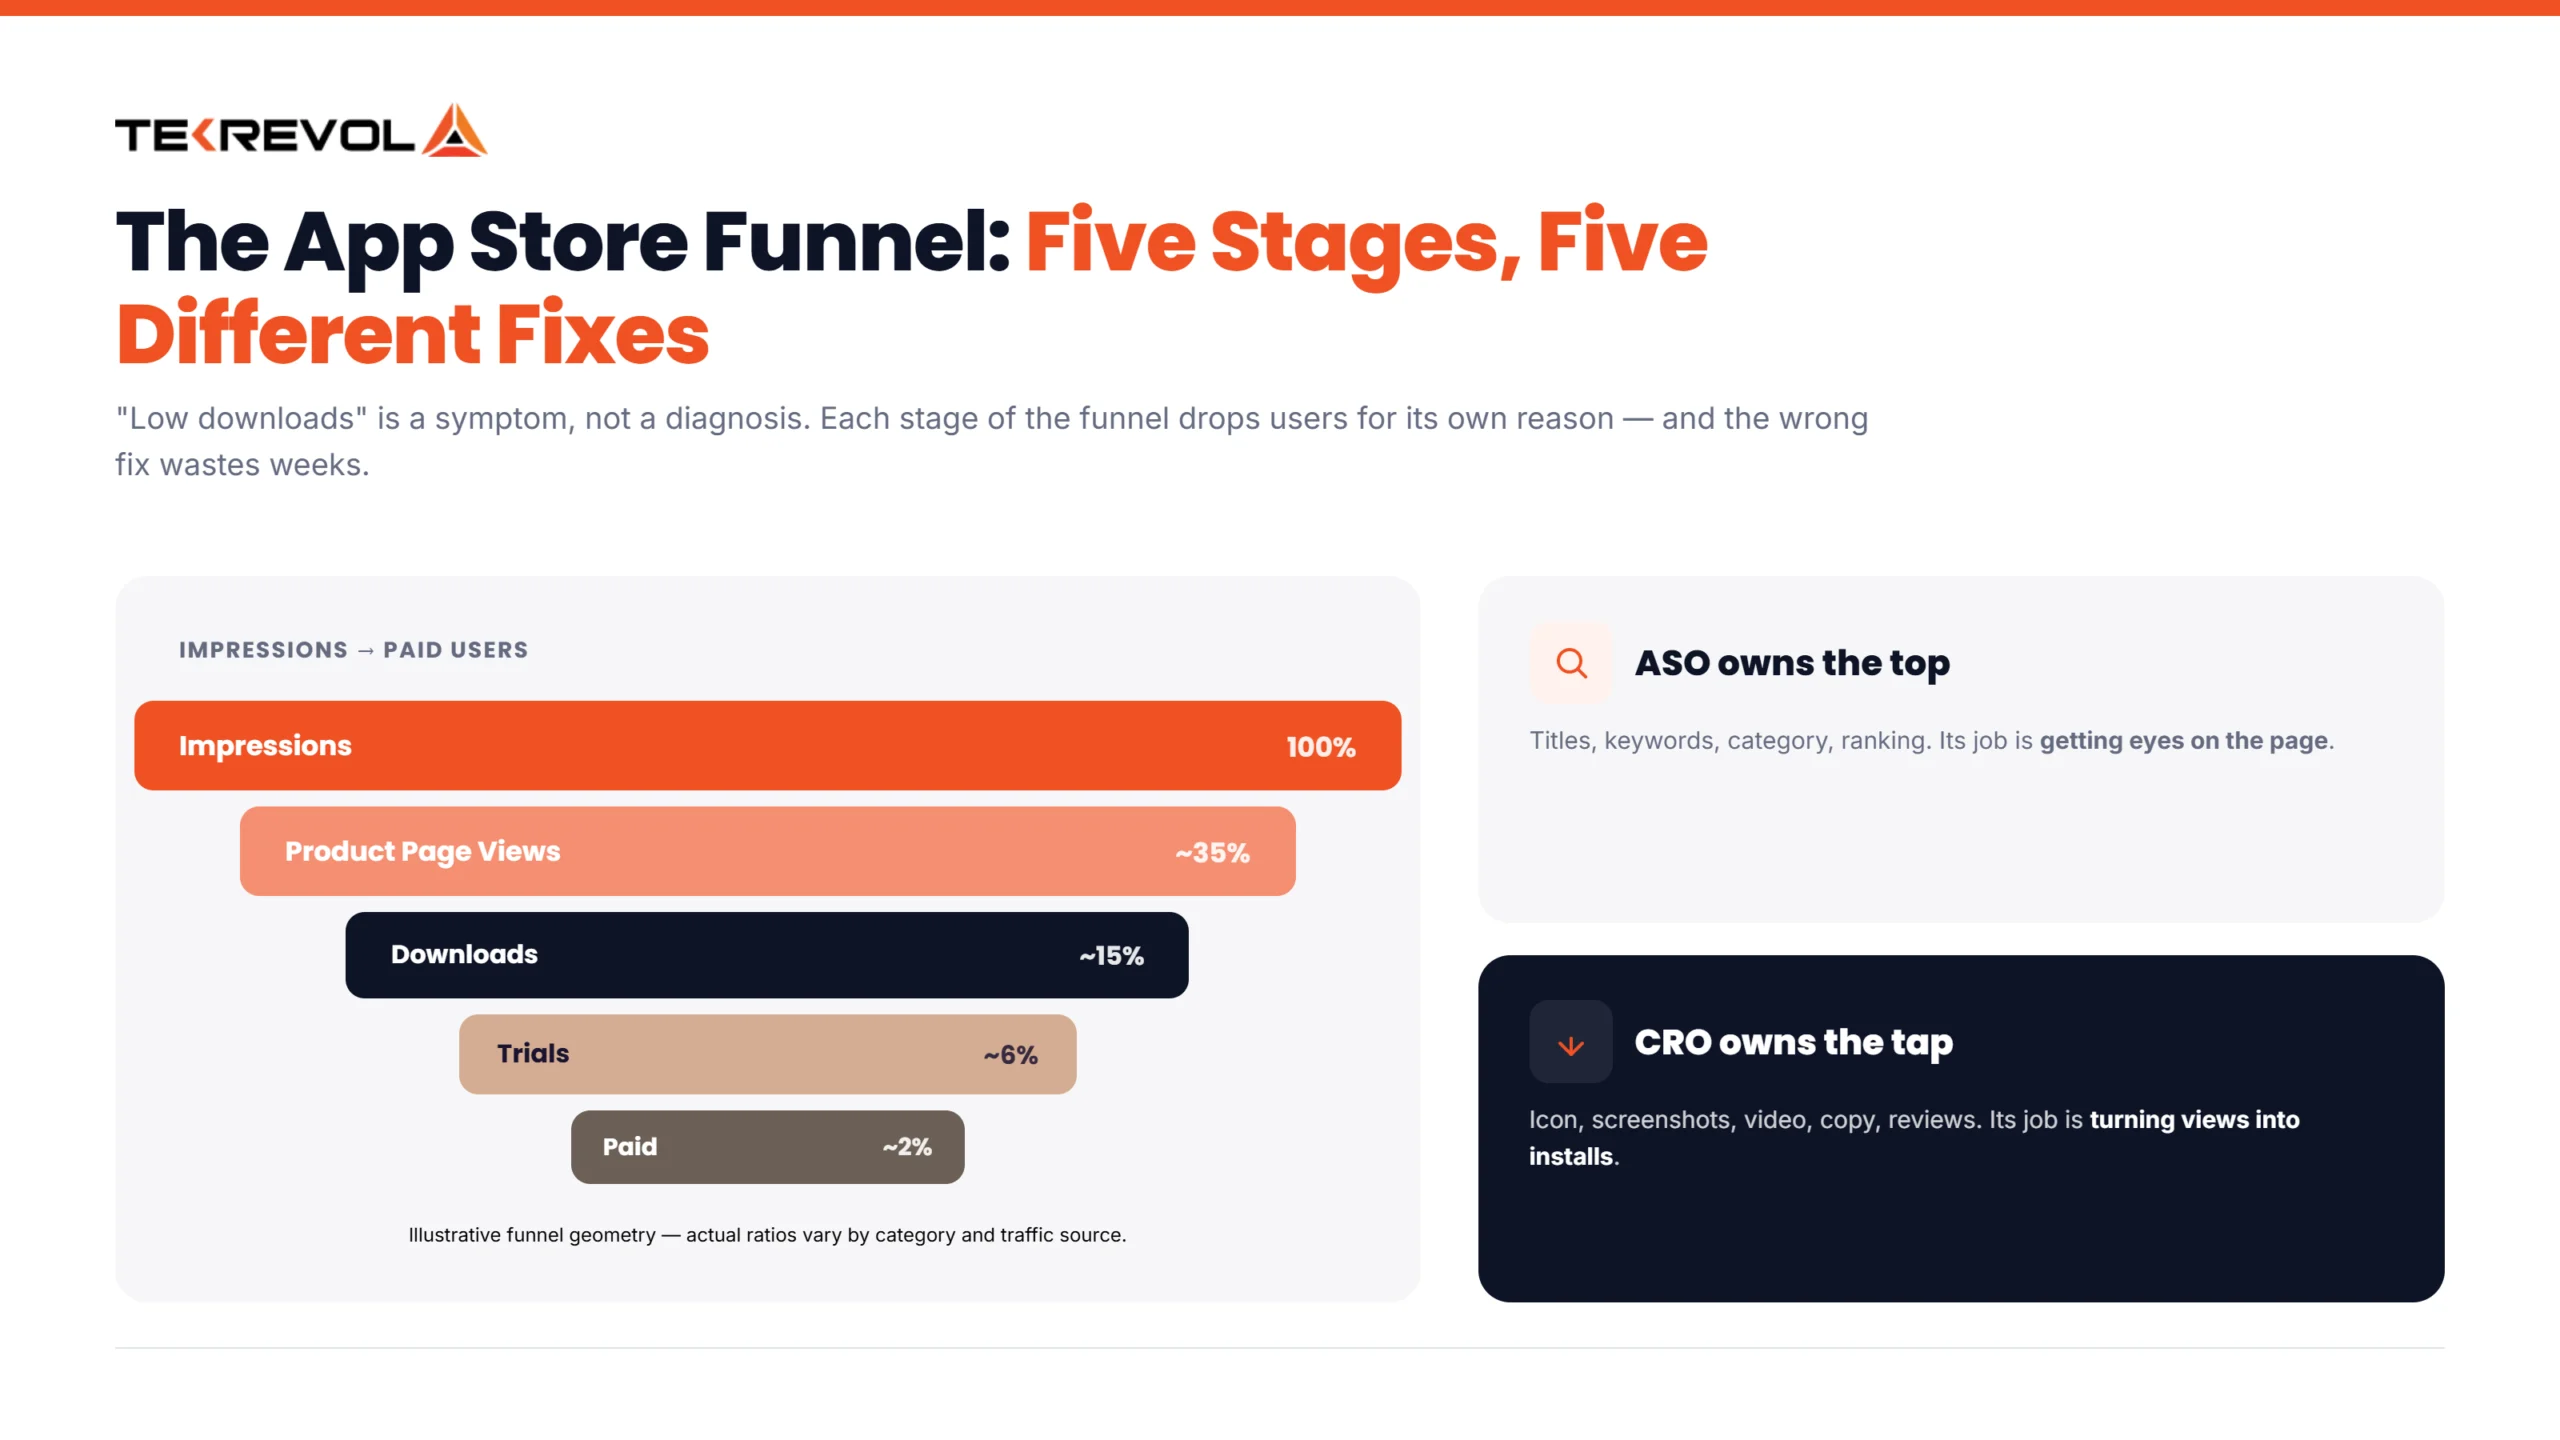
Here’s the funnel, broken down:
- Impressions: Someone sees your app anywhere in the store (search results, browse, featured sections).
- Product page views: that person clicks through to your actual app page.
- Downloads: they tap “Get” and install it.
Most people talk about “conversion rate” like it’s one thing. It’s not. A problem at stage one looks completely different from a problem at stage three, and the fix is different too.
Apple App Store Metrics (App Store Connect)
Apple gives you several key metrics in App Store Connect to see how people discover, view, and download your app. These numbers can also help you understand where your App Store Ranking Algorithm is helping you gain visibility and where users drop off.
- Impressions: The number of times your app is shown on the App Store. More impressions mean more visibility.
- Product Page Views: The number of times users view your app’s product page.
- Conversion Rate: The percentage of unique impressions that result in a download or pre-order. Conversion Rate = (Downloads + Pre-orders) ÷ Unique Device Impressions × 100.
- Downloads: The number of times users download your app, including first-time downloads and redownloads.
- Traffic by Source: Shows where users came from, such as App Store Search, Browse, Web Referrals, or App Referrals, helping you see which channels drive downloads.
Watch two numbers closely: Product Page Views and Conversion Rate. One tells you if users reach your listing. The other tells you if it converts them.
Google Play Metrics (Play Console)
Google Play measures store listing performance a little differently from Apple. In 2026, its main store listing reports focus on visitors, install clicks, and click-through rate (CTR) rather than the old conversion-rate metric.
- Store Listing Visitors: Users who visit your app’s store listing.
- Install Clicks: Unique users who click the Install button.
- Click-Through Rate (CTR): The percentage of store listing visitors who click Install, Open, or Pre-register.
- Store Listing Acquisitions: Users who visit your listing and install the app.
So don’t directly compare Apple’s conversion rate with Google Play’s current CTR. The platforms use different definitions and measurement methods.
App Store Conversion Rate vs. Product Page Conversion
These metrics look at different parts of the download journey. Apple’s official Conversion Rate uses unique impressions as the denominator, while a product-page conversion rate focuses specifically on users who viewed your product page.
For example, someone can see your app in search but never open the product page. They can still affect your overall Conversion Rate, but they won’t count as a Product Page View. Looking at both helps you understand whether you need to improve visibility or make the listing more convincing.
If you’re not sure whether your gap is visibility or conversion, our breakdown of ASO vs SEO is a useful place to separate discovery problems from listing problems first.
More Visibility Is Only Useful When It Leads to More Downloads.
Let TekRevol audit your listing, find the conversion gaps, and build a testing plan around your app and audience.
Get Your Free ASO Audit!Conversion Rate, Install Rate, and CTR: What’s the Difference?
Click-through rate measures how many people move from an App Store impression to your product page. Page conversion rate measures how many of those visitors go on to download. Apple’s own official “Conversion Rate” metric sits above both. It measures downloads against total impressions, including people who download without ever visiting your page.
| Metric | Basic formula | What it tells you | Official Apple term? |
| Click-through rate | Product Page Views ÷ Impressions × 100 | How well does your app attract users to its product page | No — calculated metric |
| Install Rate | First-time downloads ÷ Impressions × 100 | How often users install directly from search or browse results without ever opening your product page (iOS only). Average benchmark: ~3.6–3.8%. | No — calculated metric |
| Product Page Conversion Rate | Downloads ÷ Product Page Views × 100 | How well your product page turns visitors into downloads | No — calculated metric |
| Conversion Rate | (Downloads + Pre-orders) ÷ Unique Device Impressions × 100 | How effectively your app turns unique impressions into downloads or pre-orders | Yes — official Apple metric |
Each stage tells you something different. A weak result at one point in the funnel doesn’t automatically mean the rest is underperforming. Apple and Google Play also use different reporting methods, so their conversion numbers aren’t directly comparable.
Can App Store Conversion Rate Be More Than 100%?
Yes, Apple’s App Store Conversion Rate can exceed 100%. This can happen because Apple calculates the conversion rate using total downloads and pre-orders divided by unique device impressions, rather than product page views. Total downloads can also include redownloads.
- 1,000 unique device impressions
- 1,050 total downloads and pre-orders
- Conversion Rate: 105%
So, a rate above 100% isn’t necessarily a reporting error. It reflects how Apple defines and calculates the metric.
What Is a Good App Store Conversion Rate in 2026?
There is no single “good” App Store conversion rate for every app. Your benchmark depends on your category, traffic source, audience, platform, and how the metric is calculated.
Overall Benchmarks: App Store vs. Google Play
Organic and paid traffic can convert very differently. Users who find your app through relevant searches may already be interested, while users coming from ads may need more convincing before they install.
Benchmark numbers also vary because different reports measure conversion differently. Some look at product page views and downloads, while others use impressions, visitors, or acquisitions. Apple and Google Play also use different reporting methods, so their numbers aren’t always directly comparable.
Instead of chasing one “good” number, compare your app with relevant category benchmarks and track your own conversion rate over time. Break the data down by traffic source and platform to see what’s working and where users are dropping off.
Conversion Rate by Category
Category has a big impact on what counts as a good conversion rate. High-intent categories can convert much better than apps that users mainly browse for entertainment. Benchmarks also vary by country, traffic source, app type, and date range, so use these figures as directional benchmarks rather than fixed targets.
| Category | App Store CVR | Google Play CVR |
| Navigation | ~115% | — |
| Weather | ~79.8% | — |
| Reference | ~67.2% | — |
| Business | ~66.7% | — |
| Photo & Video | ~60.8% | — |
| Auto & Vehicles | — | ~70% |
| Finance | ~32.8% | ~19.7% |
| Education | ~16.8% | ~30.4% |
| Food & Drink | ~12.1% | ~18.5% |
| Games | Generally lower | Generally lower |
These figures are directional category benchmarks, not universal 2026 targets. Actual performance can vary significantly based on market, traffic source, app type, and measurement period.
Games’ “generally lower” hides a wide range. Racing and trivia games convert around 20%, while board games sit near 1.2%, a 20x difference within one category. If your game underperforms, compare it against your specific subgenre, not “Games” as a whole.
Why “Good” Depends on Your Category
A trivia game and a food delivery app have very different users. Someone searching for a navigation or food app usually knows what they need. Game users are more likely to browse several options before choosing one. That’s why some high-intent categories can have much higher conversion rates than games. Always compare your app with similar apps in your category, not a general industry average.
Why Is My App Store Conversion Rate Low?
Your App Store conversion rate is low because something between the view and the download isn’t convincing people fast enough, and it’s almost always one of seven specific things.
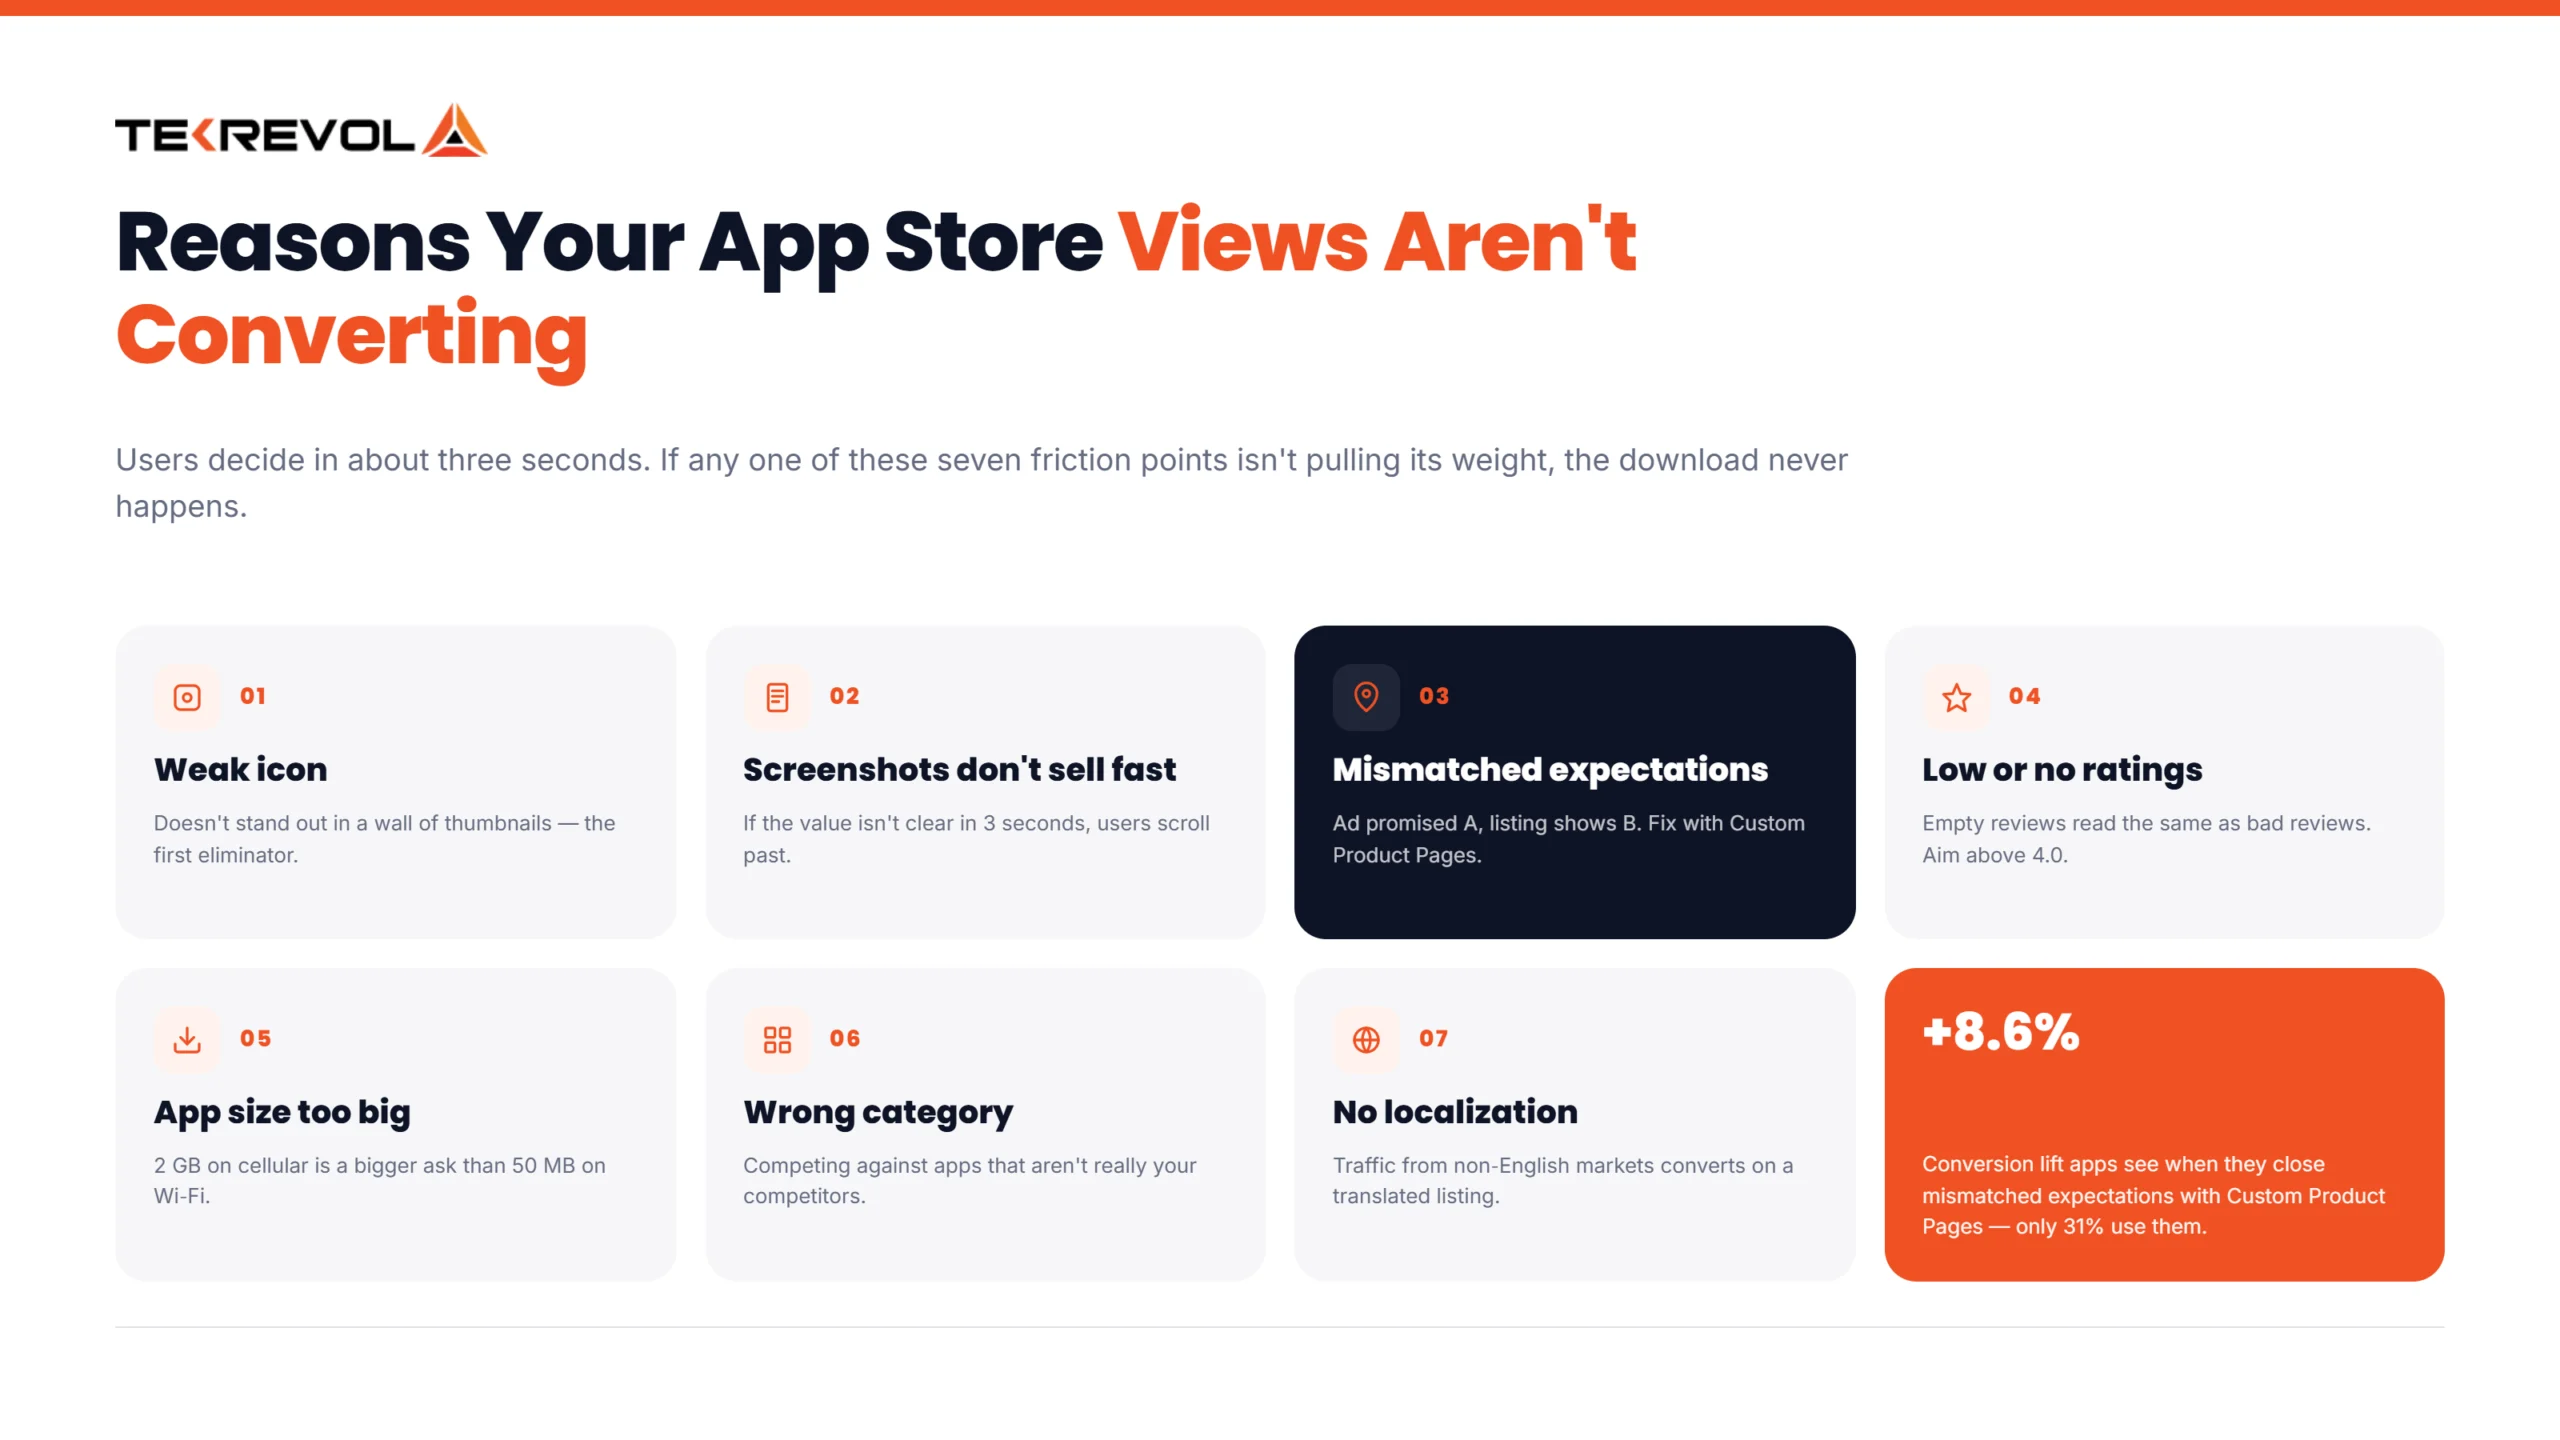
7 Common Reasons Your Views Aren’t Converting:
- Weak icon: It doesn’t stand out in a wall of search results.
- Screenshots don’t sell in 3 seconds: Users decide fast. If your screenshots don’t communicate value instantly, they scroll past.
- Mismatched expectations: Your ad promised one thing; your store listing shows another. Users notice, and trust drops. Custom Product Pages fix this, matching your listing to the ad that brought the user there. They’re still underused (only 31% of apps use them), but apps that do see conversion lifts to +8.6%.
- Low or no ratings: People check reviews before downloading. No review reads the same as bad reviews.
- App size is too big: A 2GB download is a bigger ask than a 50MB one, especially on mobile data.
- Wrong category: You’re competing against apps that aren’t really your competitors, so your listing doesn’t stand out.
- No localization: Your listing is in English, but a big chunk of your traffic isn’t reading English as a first language.
Your Next Conversion Win Could Be Hiding in Your Listing.
Let our ASO team identify the weak spots and show you what to test next.
Request Your Free Audit!How to Identify and Fix Conversion Drop-Offs?
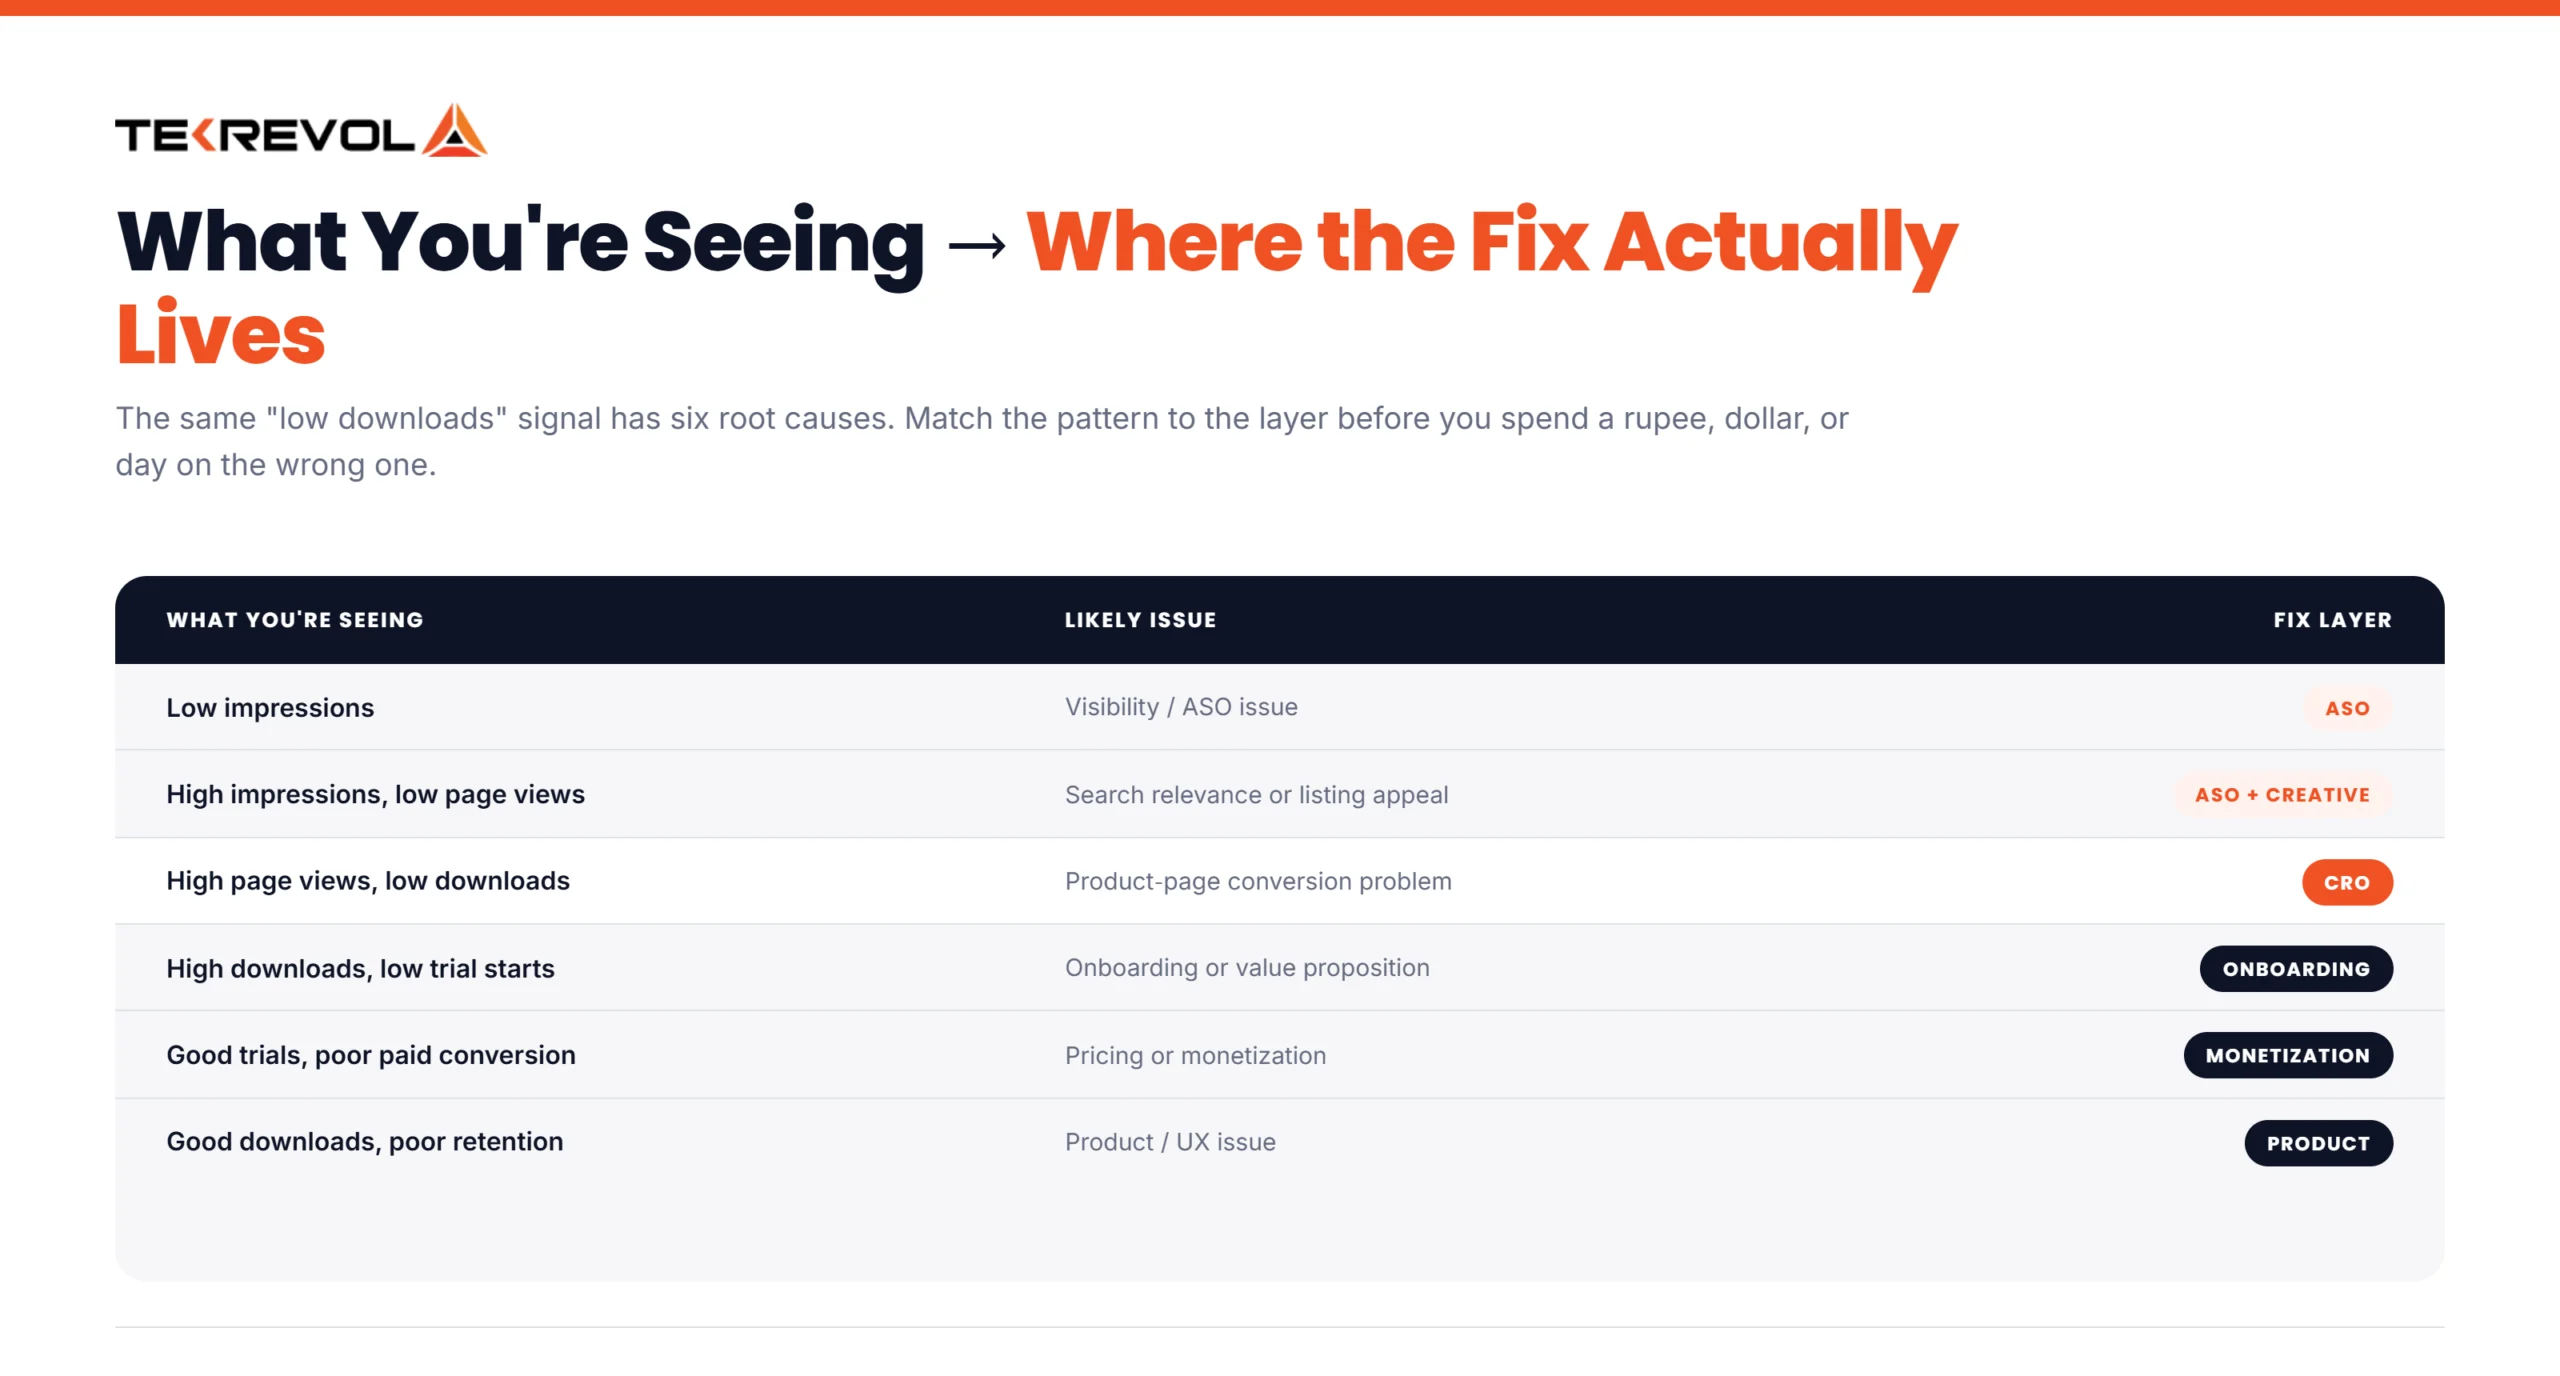
Start by finding the weakest stage of your funnel. The right fix depends on where users are dropping off, so don’t assume low downloads always mean you need more traffic.
| What you’re seeing | Likely issue |
| Low impressions | Visibility or ASO issue |
| High impressions, low page views | Search relevance or listing appeal |
| High page views, low downloads | App Store CRO issue |
| High downloads, low trial starts | Onboarding or value proposition issue |
| Good trials, poor paid conversion | Pricing or monetization issue |
| Good downloads, poor retention | Product or user experience issue |
This tells you where to focus your next effort and helps you avoid a common mistake: trying to solve a conversion problem by bringing in more traffic. If only 10% of visitors download, doubling your traffic won’t fix the weak conversion. It just sends more users through the same leaky funnel.
Why Won’t More Traffic Fix a Poor Conversion Rate?
More traffic won’t fix a weak product page if the same percentage of visitors keeps leaving without downloading.
For example:
- 10,000 visitors × 10% conversion = 1,000 downloads
- 20,000 visitors × 10% conversion = 2,000 downloads
But if CRO increases your conversion rate from 10% to 15%:
- 10,000 visitors × 15% conversion = 1,500 downloads
That’s 500 extra downloads from the same amount of traffic. This is why CRO can be a strong growth lever. It helps you get more downloads from the users you’re already attracting.
The impact becomes even clearer at higher conversion rates. Moving from 25% to 32% would generate 28% more installs from the same traffic, assuming everything else stays the same.
CRO and ASO work together. ASO helps bring more people to your app, while CRO helps turn those visitors into downloads. Improving both gives you a stronger path from visibility to installs.
Factors That Affect App Store Conversion Rate
Your conversion rate depends on more than just your product page. Creative assets, traffic quality, category, ratings, monetization, app size, and localization can all influence whether someone decides to install.
- Creative assets: Your icon, screenshots, and preview video shape the first impression and can strongly influence the install decision.
- Traffic quality: Relevant users are more likely to convert than people who discover your app through broad, low-intent traffic.
- Category: Your category and ranking affect the type and volume of users who discover your app through search and browsing.
- Ratings and reviews: Strong ratings and positive reviews build trust, while poor ratings or repeated complaints can discourage downloads.
- Monetization: Free and paid apps face different conversion dynamics because asking users to pay upfront creates more friction.
- App size: A large download can create extra friction, especially for users with limited storage or slower connections.
- Localization: Adapting your listing to the local language and market can make your app more relevant to users in that region.
How to Improve Your App Store Conversion Rate (Step-by-Step)
Start with the parts users notice first: your icon, screenshots, and app preview. Then improve your copy, localization, and testing strategy.
Optimize Your App Icon
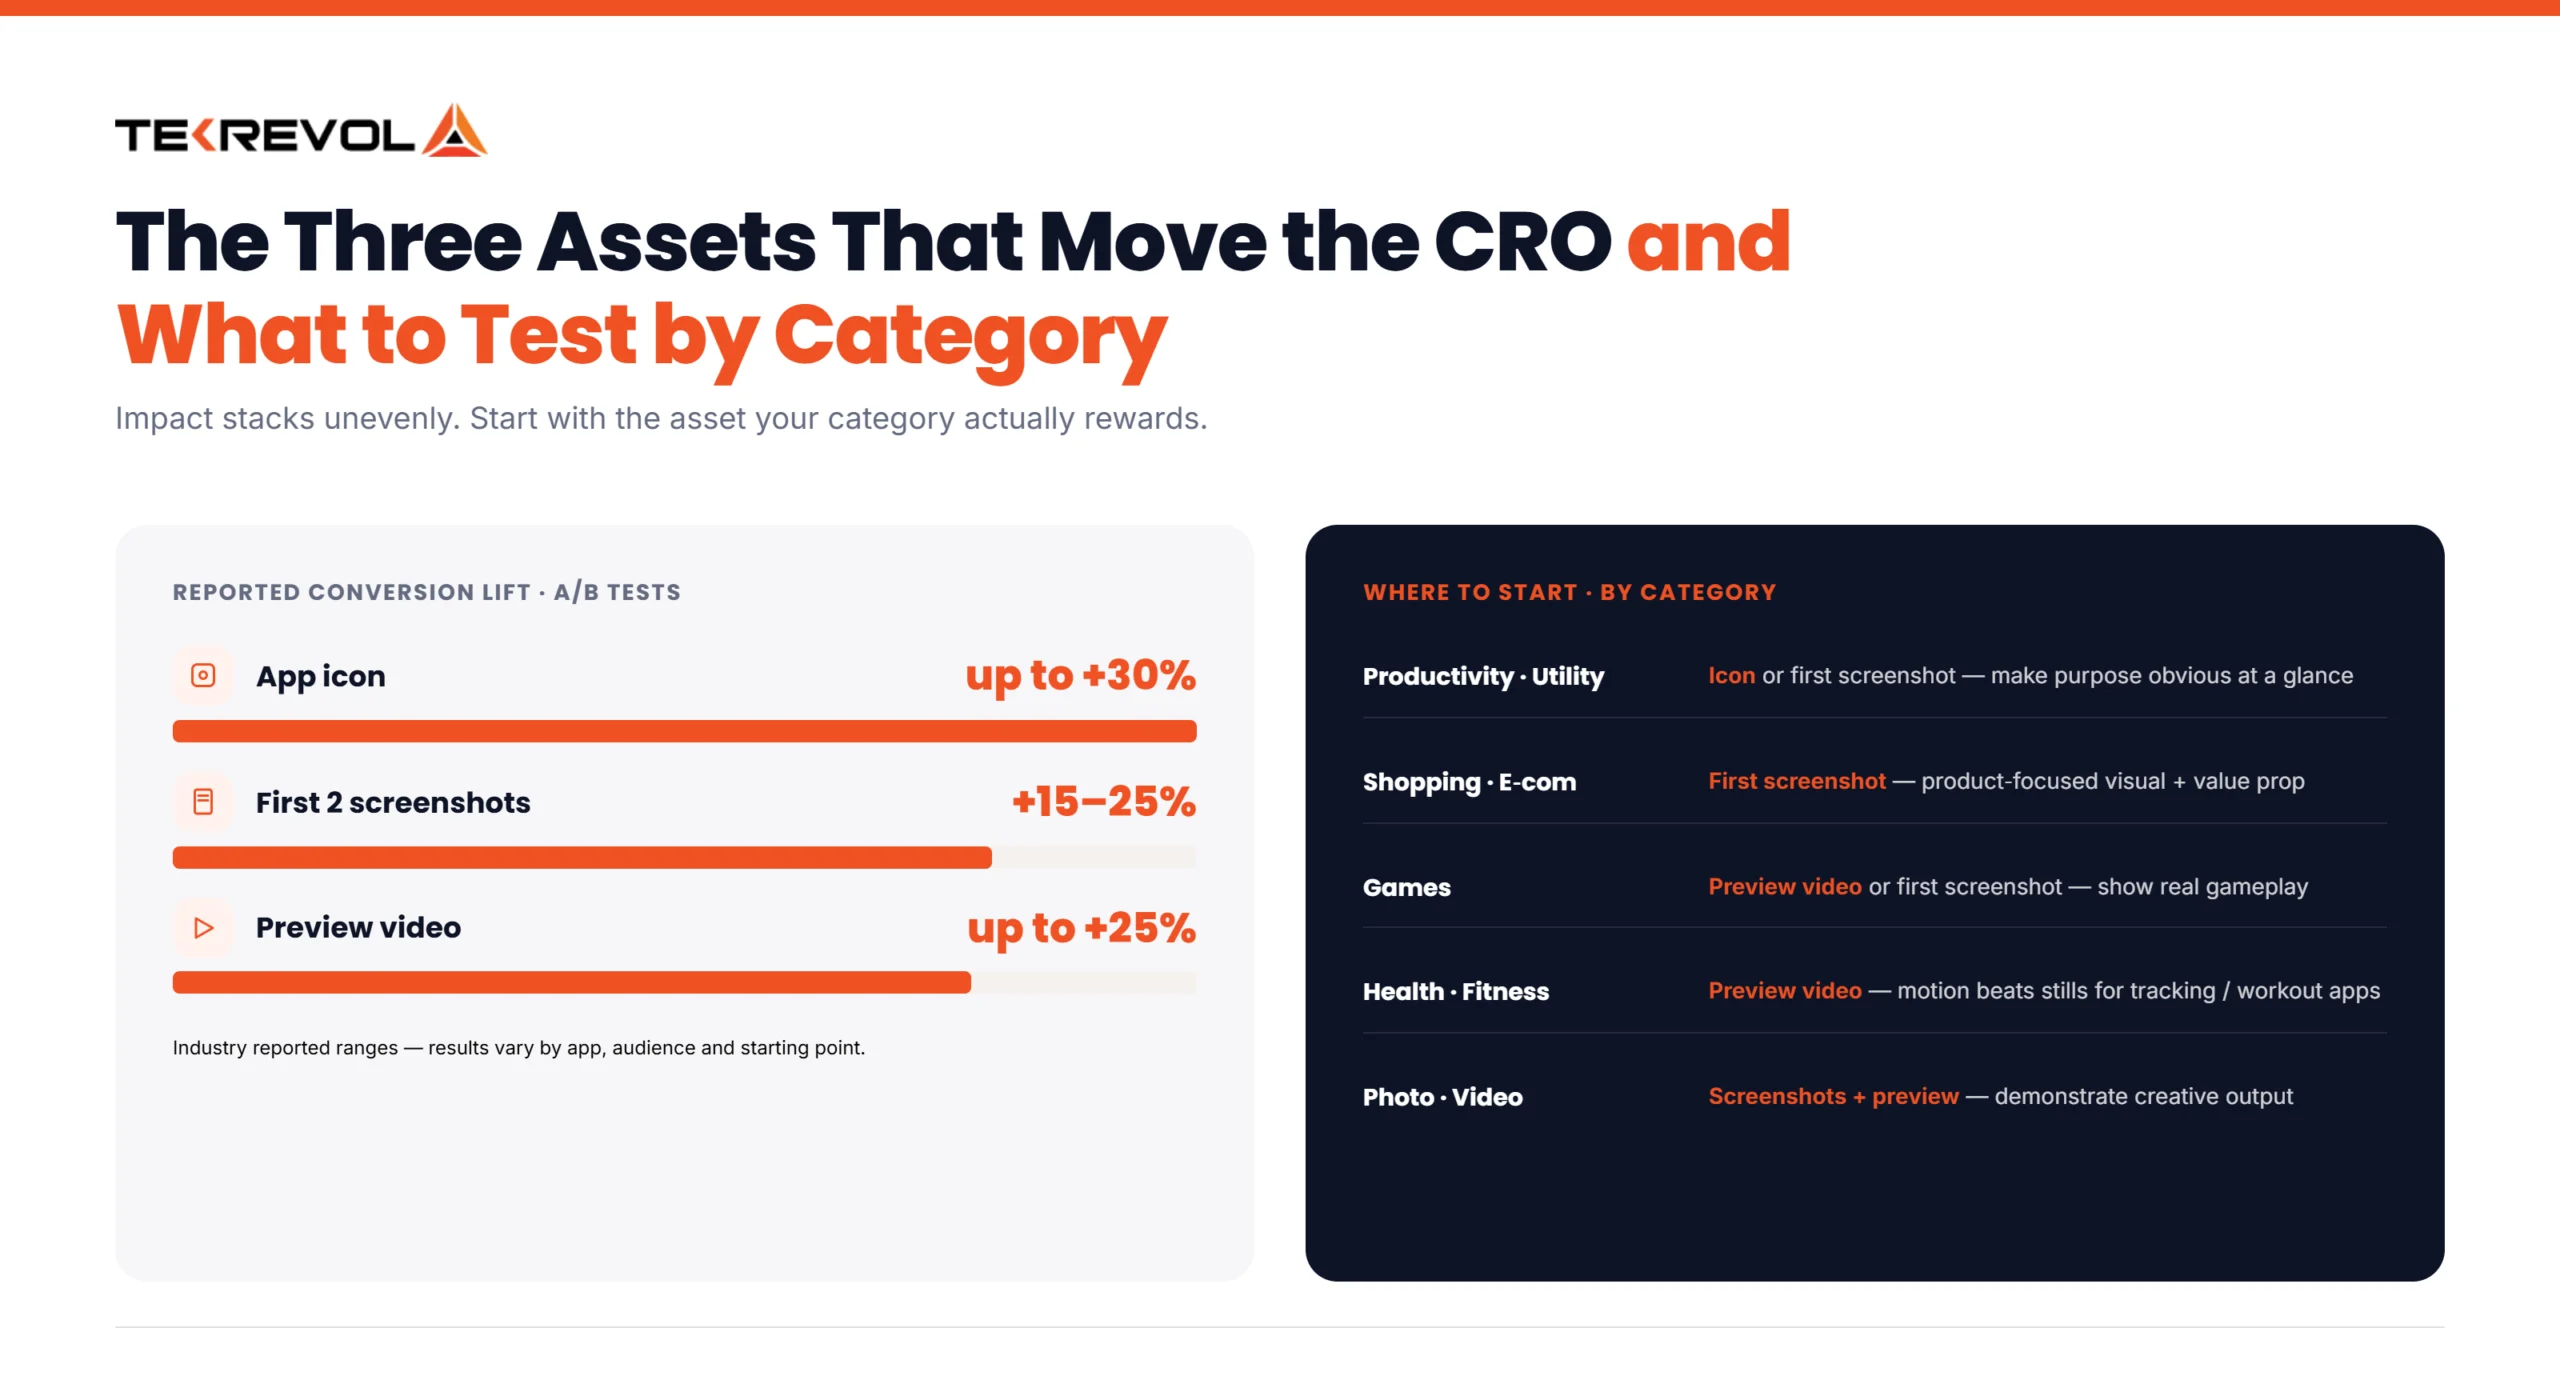
Your icon carries an outsized share of the decision. Industry A/B testing has shown icon changes alone driving conversion lifts as high as +30% in some cases. Results vary, but even a small improvement can make an icon test one of the easiest ways to boost conversions early.
Three rules:
- Make it reflect your brand, like colors, style, and consistency.
- Give it a visual hint at what the app actually does.
- Look at what your category does, then do something different enough to stand out.
Optimize Your Screenshots
Your first three screenshots can appear directly in App Store search results, before users even open your listing. That makes the first two especially important. Testing data shows that improving screenshots can lift installs by around 15–25%, although results vary by app and starting point. Put your strongest message there, not buried in screenshot six.
Keep your screenshots:
- Focused on one clear benefit at a time
- Easy to read at a small size
- Consistent with your brand
- Relevant to the reason users are searching for your app
Lead with your strongest value proposition instead of saving it for later screenshots.
Write Clear, Relevant Metadata
Your title, subtitle, and description should explain what your app does while naturally targeting relevant search terms. Don’t stuff keywords at the expense of readability.
Apple says App Store search considers factors including text relevance across the app name, subtitle, keywords, and category, along with user behavior such as downloads, ratings, and reviews.
Use your metadata to answer two questions quickly:
- What does this app do?
- Why should I download it?
Optimize Your Preview Video
Video isn’t mandatory, but when it fits your category, it can meaningfully lift installs. Some tests have shown increases of up to 25%, though results vary by app, audience, and how well the video is executed.
Categories like Photo & Video and Health & Fitness lean on video heavily because the product itself is visual; seeing it in motion does more than a static screenshot ever could. In other categories, like utilities or productivity, video barely moves the needle, since there’s not much to “show” beyond what a screenshot already communicates.
Check what your top competitors are doing before you spend the budget. If most of them skip video, that’s a signal it’s not carrying much weight in your category.
Localize Your Store Listing
Localization can make your listing more relevant to users in different markets. Go beyond direct translation when localizing screenshots, copy, currencies, examples, and cultural references.
Apple recommends localizing product pages to help users in different regions understand the app and may improve their likelihood of downloading.
Google Play also supports up to 50 custom store listing pages, allowing you to tailor listings for different audiences and segments.
Manage Ratings and Reviews
Keep your average above 4.0. That’s generally the threshold where users start trusting an app by default instead of digging into individual reviews. Respond to negative reviews. Prompt happy users for ratings at the right moment, right after a win inside your app, not on first open.
A/B Test Everything
Don’t guess which version will convert better. Test it.
Apple Product Page Optimization (PPO) lets you test different app icons, screenshots, and app previews against your original product page. Apple provides conversion-rate and confidence data to help identify stronger variants. Apple allows up to three treatments per test, and tests can run for up to 90 days. The right test duration depends on your traffic and the improvement you’re trying to measure
Google Play Store Listing Experiments provide a similar way to test listing elements in Play Console. For either platform, start with a clear hypothesis. Test meaningful changes, give the experiment enough traffic to produce useful results, and don’t call a winner too early.
Writing for AI-Powered Search
Both app stores are increasingly using AI to interpret metadata rather than matching exact keyword strings, which means natural, benefit-led phrasing now carries more weight than keyword-stuffed copy. AI tools can help generate and test metadata variations at scale, but treat them as a brainstorming aid, not an autopilot. Brand voice consistency and strategic keyword placement still need a human pass before anything goes live.
What Should You Test First?
There’s no universal testing order. Start with the asset most likely to influence your audience, then use your own data to decide what to test next.
- Productivity and utility: Start with the icon or first screenshot. Test which version makes the app’s purpose clearer and more appealing at a glance.
- Shopping and e-commerce: Start with the first screenshot. Test different product-focused visuals and value propositions.
- Games: Test the first screenshot or preview video. Show the actual gameplay and experience rather than relying mainly on feature lists.
- Health & fitness and photo & video apps: Preview videos can have a bigger impact in these categories than in others. Before investing in one, check what your top competitors are using. For apps we build, such as Pure Plank, we’ve found that showing the actual workout or tracking experience can work better than using purely illustrative screenshots.
- Photo & video: Test screenshots and previews that clearly demonstrate the app’s creative capabilities.
Match this against your own category row in the benchmark table above before deciding where to spend your first testing cycle.
The App Store CRO Checklist
The best App Store CRO process is a repeatable cycle of measuring, testing, and improving your product page.
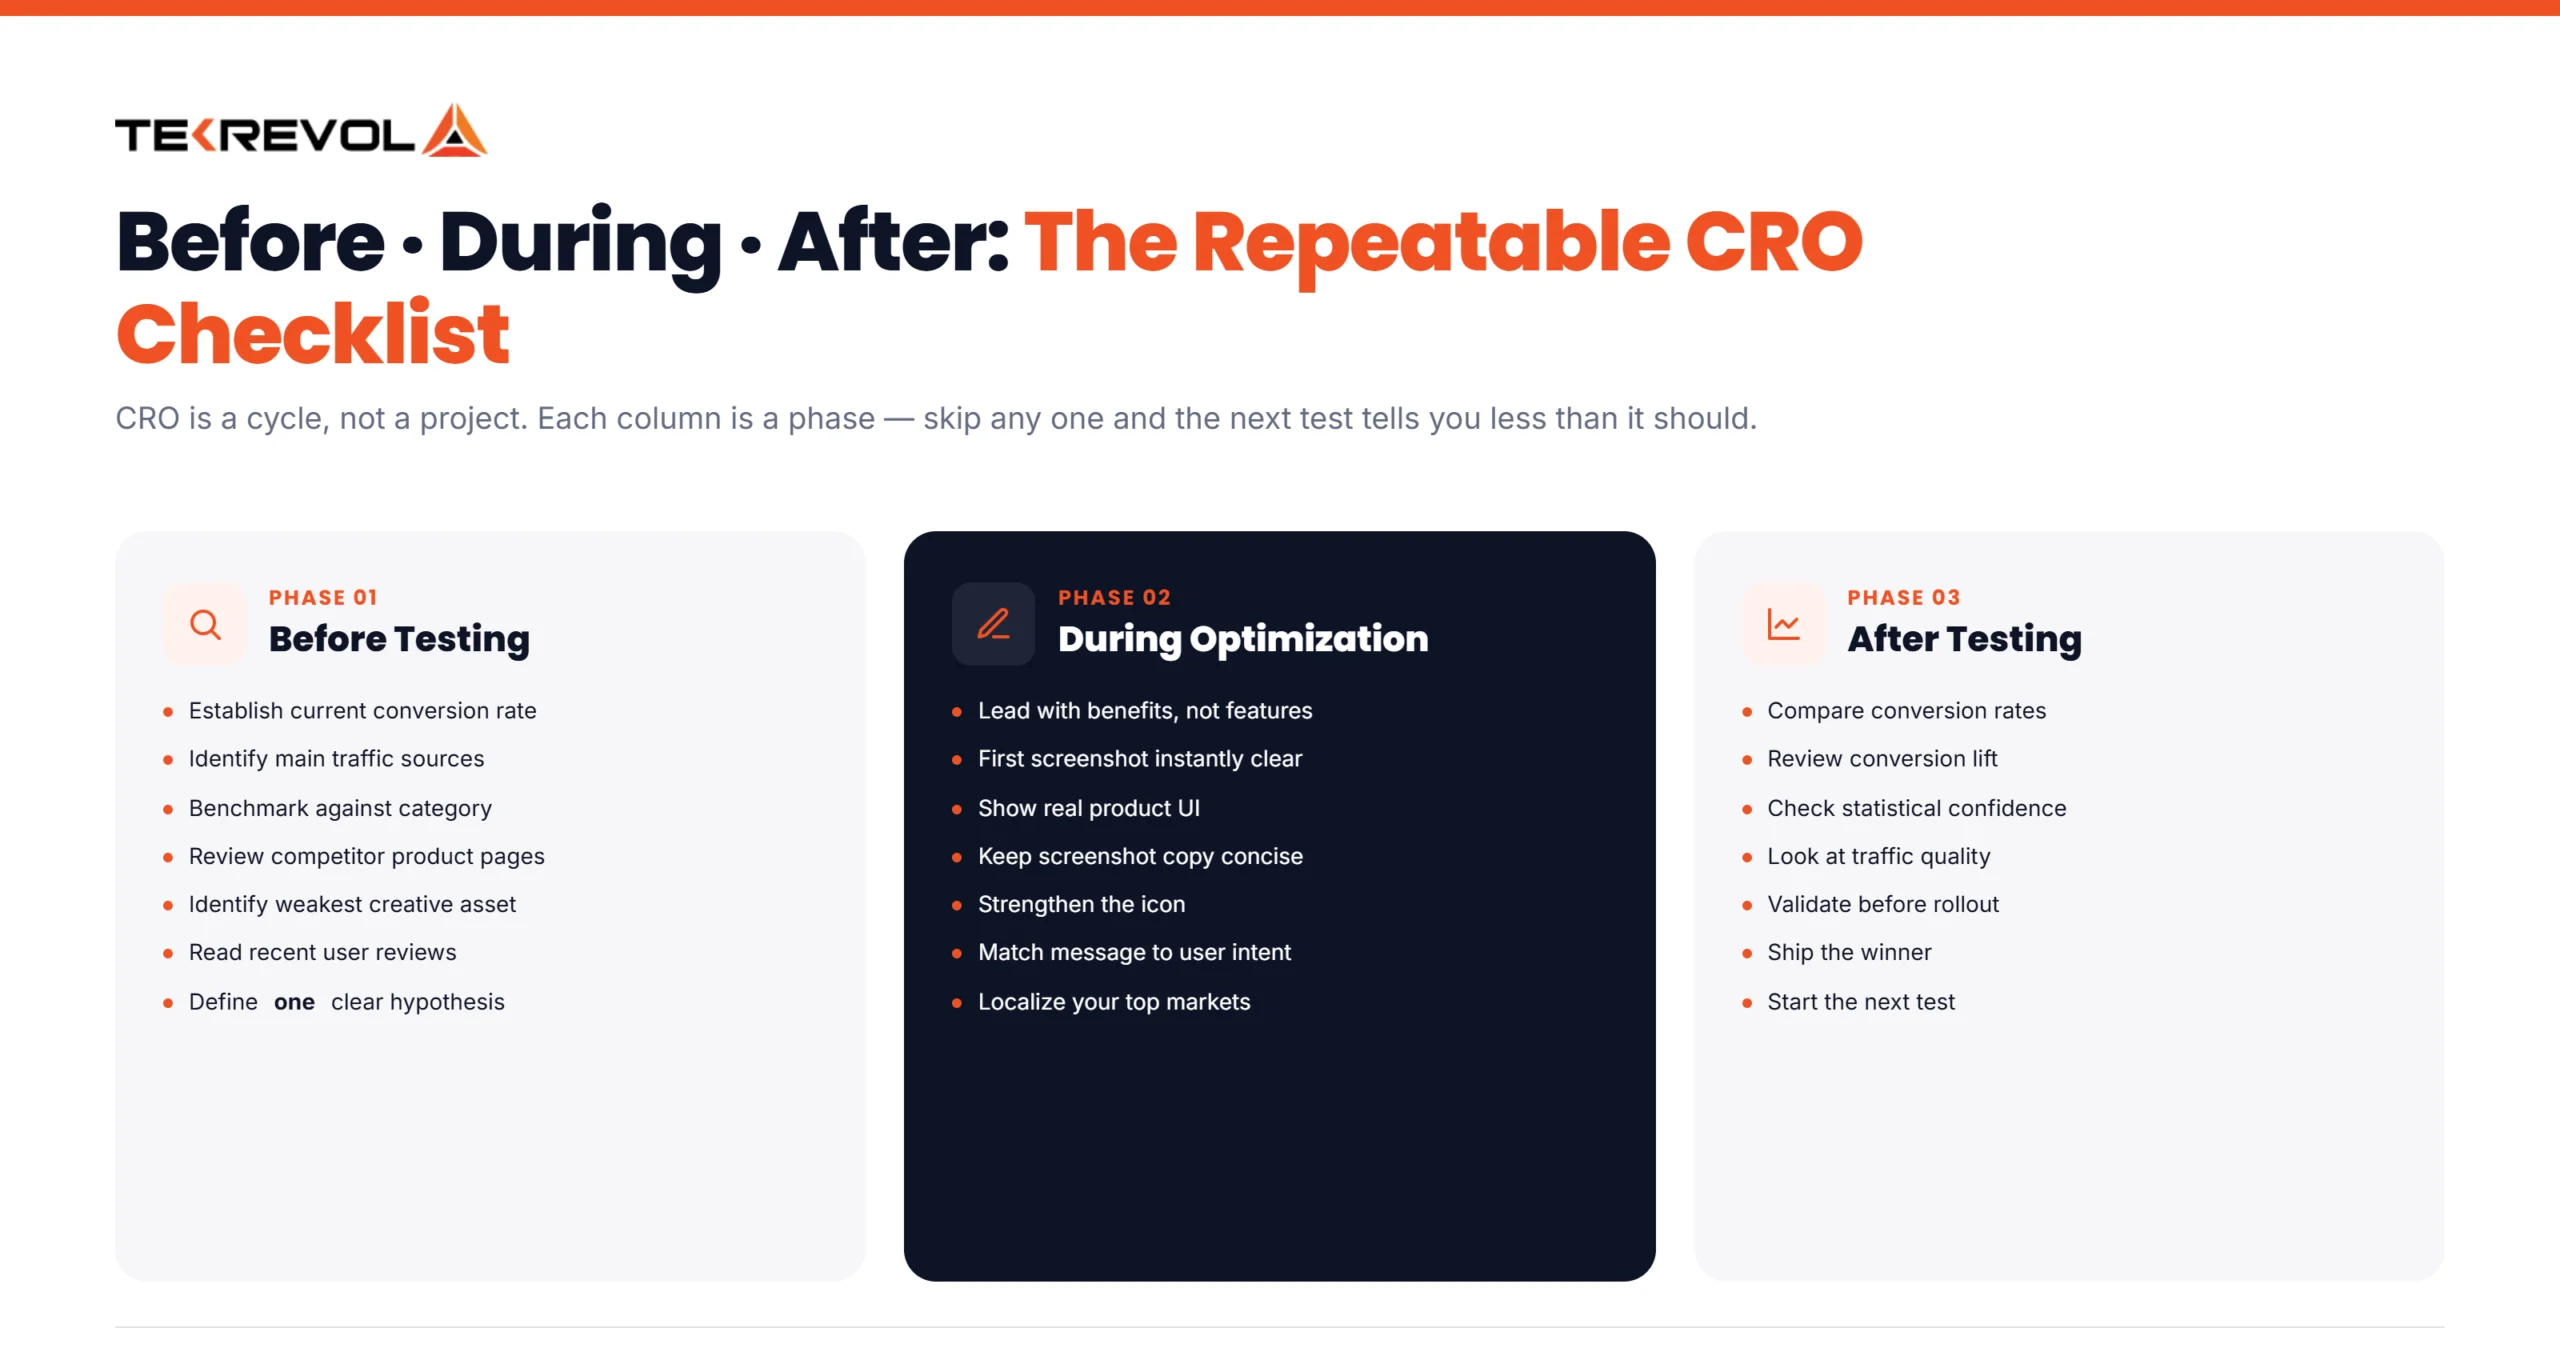
Before Testing
- Establish your current conversion rate
- Identify your main traffic sources
- Benchmark against your category
- Review competitor product pages
- Identify your weakest creative asset
- Read recent user reviews
- Define one clear hypothesis
During Optimization
- Lead with benefits
- Make the first screenshot instantly clear
- Show real product UI
- Keep screenshot copy concise
- Strengthen your app icon
- Improve trust signals
- Match messaging to user intent
- Localize important markets
- Test meaningful changes
After Testing
- Compare conversion rates
- Review conversion lift
- Check statistical confidence
- Look at traffic quality
- Validate the result
- Roll out the winning version
- Start the next test
CRO isn’t a one-time project. Keep testing, learning from the data, and improving the listing over time.
App Store CRO for the MENA & Kuwait Market
App Store CRO in Kuwait and the wider GCC region hinges on Arabic localization, seasonal timing, and payment expectations more than it does in most UK or US markets.
Localization is a conversion lever, not a checkbox: A properly translated and culturally adapted Arabic listing, not a machine translation, converts meaningfully better with local users. This isn’t optional if you’re serious about the market.
Seasonality matters more here: Download behavior shifts hard around Ramadan and Eid. That’s a natural window to run A/B tests, since traffic volume spikes give you faster, more reliable results.
Payment norms differ: GCC users have specific expectations around local payment methods and pricing display. If your monetization flow doesn’t match local habits, you’ll see the drop-off in your conversion data before you see it anywhere else.
How Tekrevol Can Help With App Store CRO
Tekrevol helps you close the gap between views and downloads by running your entire App Store CRO process for you- audit, creative, testing, and reporting- all in one place.
We’ve worked across categories that convert very differently, like games, fintech, health apps, and e-commerce, so we don’t apply one generic playbook to every client. Our ASO experts also know the MENA market specifically, which matters if your users are in Kuwait or the wider Gulf region, and a copy-pasted US strategy just won’t land the same way.
Here’s what that looks like in practice:
- Creative asset design and testing: Icons, screenshots, and preview videos built and A/B tested, not just designed and hoped for.
- Keyword and metadata strategy: Titles, subtitles, and descriptions written to convert, not just to rank.
- Store experiment management: Running Apple Product Page Optimization and Google Play Store Listing Experiments on your behalf.
- Localization for MENA and GCC markets: Real Arabic localization, not machine translation, built around how users in the region actually search and buy.
Ready to Turn More App Store Visitors Into Downloads?
Our ASO team can help you build, test, and optimize a listing that converts more of the traffic you're already getting.
Schedule a FREE Consultation Now!


